Documentation
2234 Vibration Route Data Collector
MS-2234: Route Data Collector iPadOS® version
- Version: 1.10 (b.72)
- Author: SensOS
- Created: 04 Feb, 2022
- Update: 22 Nov, 2022
If you have any questions that are beyond the scope of this document, Please feel free to email via info@sens-os.com
Description
The MS-2234 is a tablet-based route data collector software that allows connectivity with different Condition Based Monitoring devices, such as wireless accelerometers, thermal image cameras, ultrasonic devices, etc. It also allows to perform visual inspection tasks using the tablet's camera and manual data entry.
The MultiSens Cloud platform allows the creation of routes and interaction with the MS-2234 App. Data from each route can then be uploaded to the cloud platform for trending, analysis and Reporting. See more details of the MultiSens Cloud platform in the MS-Cloud Documentation.
This section will focus on the route-based vibration data collection feature.
Compatibility
The MS-2234 Route Data collector is compatible with the following Vibration Sensors:
- SensorWorks BluVib P-V-T (1 Axis)
- SensorWorks BluVib M-V-T-3 (3 Axis)
- EI-WiSER™3X (3 Axis)
- Sensoteq® Chi (3 Axis)
- CTC WA102-1A (1 Axis)
Routes Dashboard
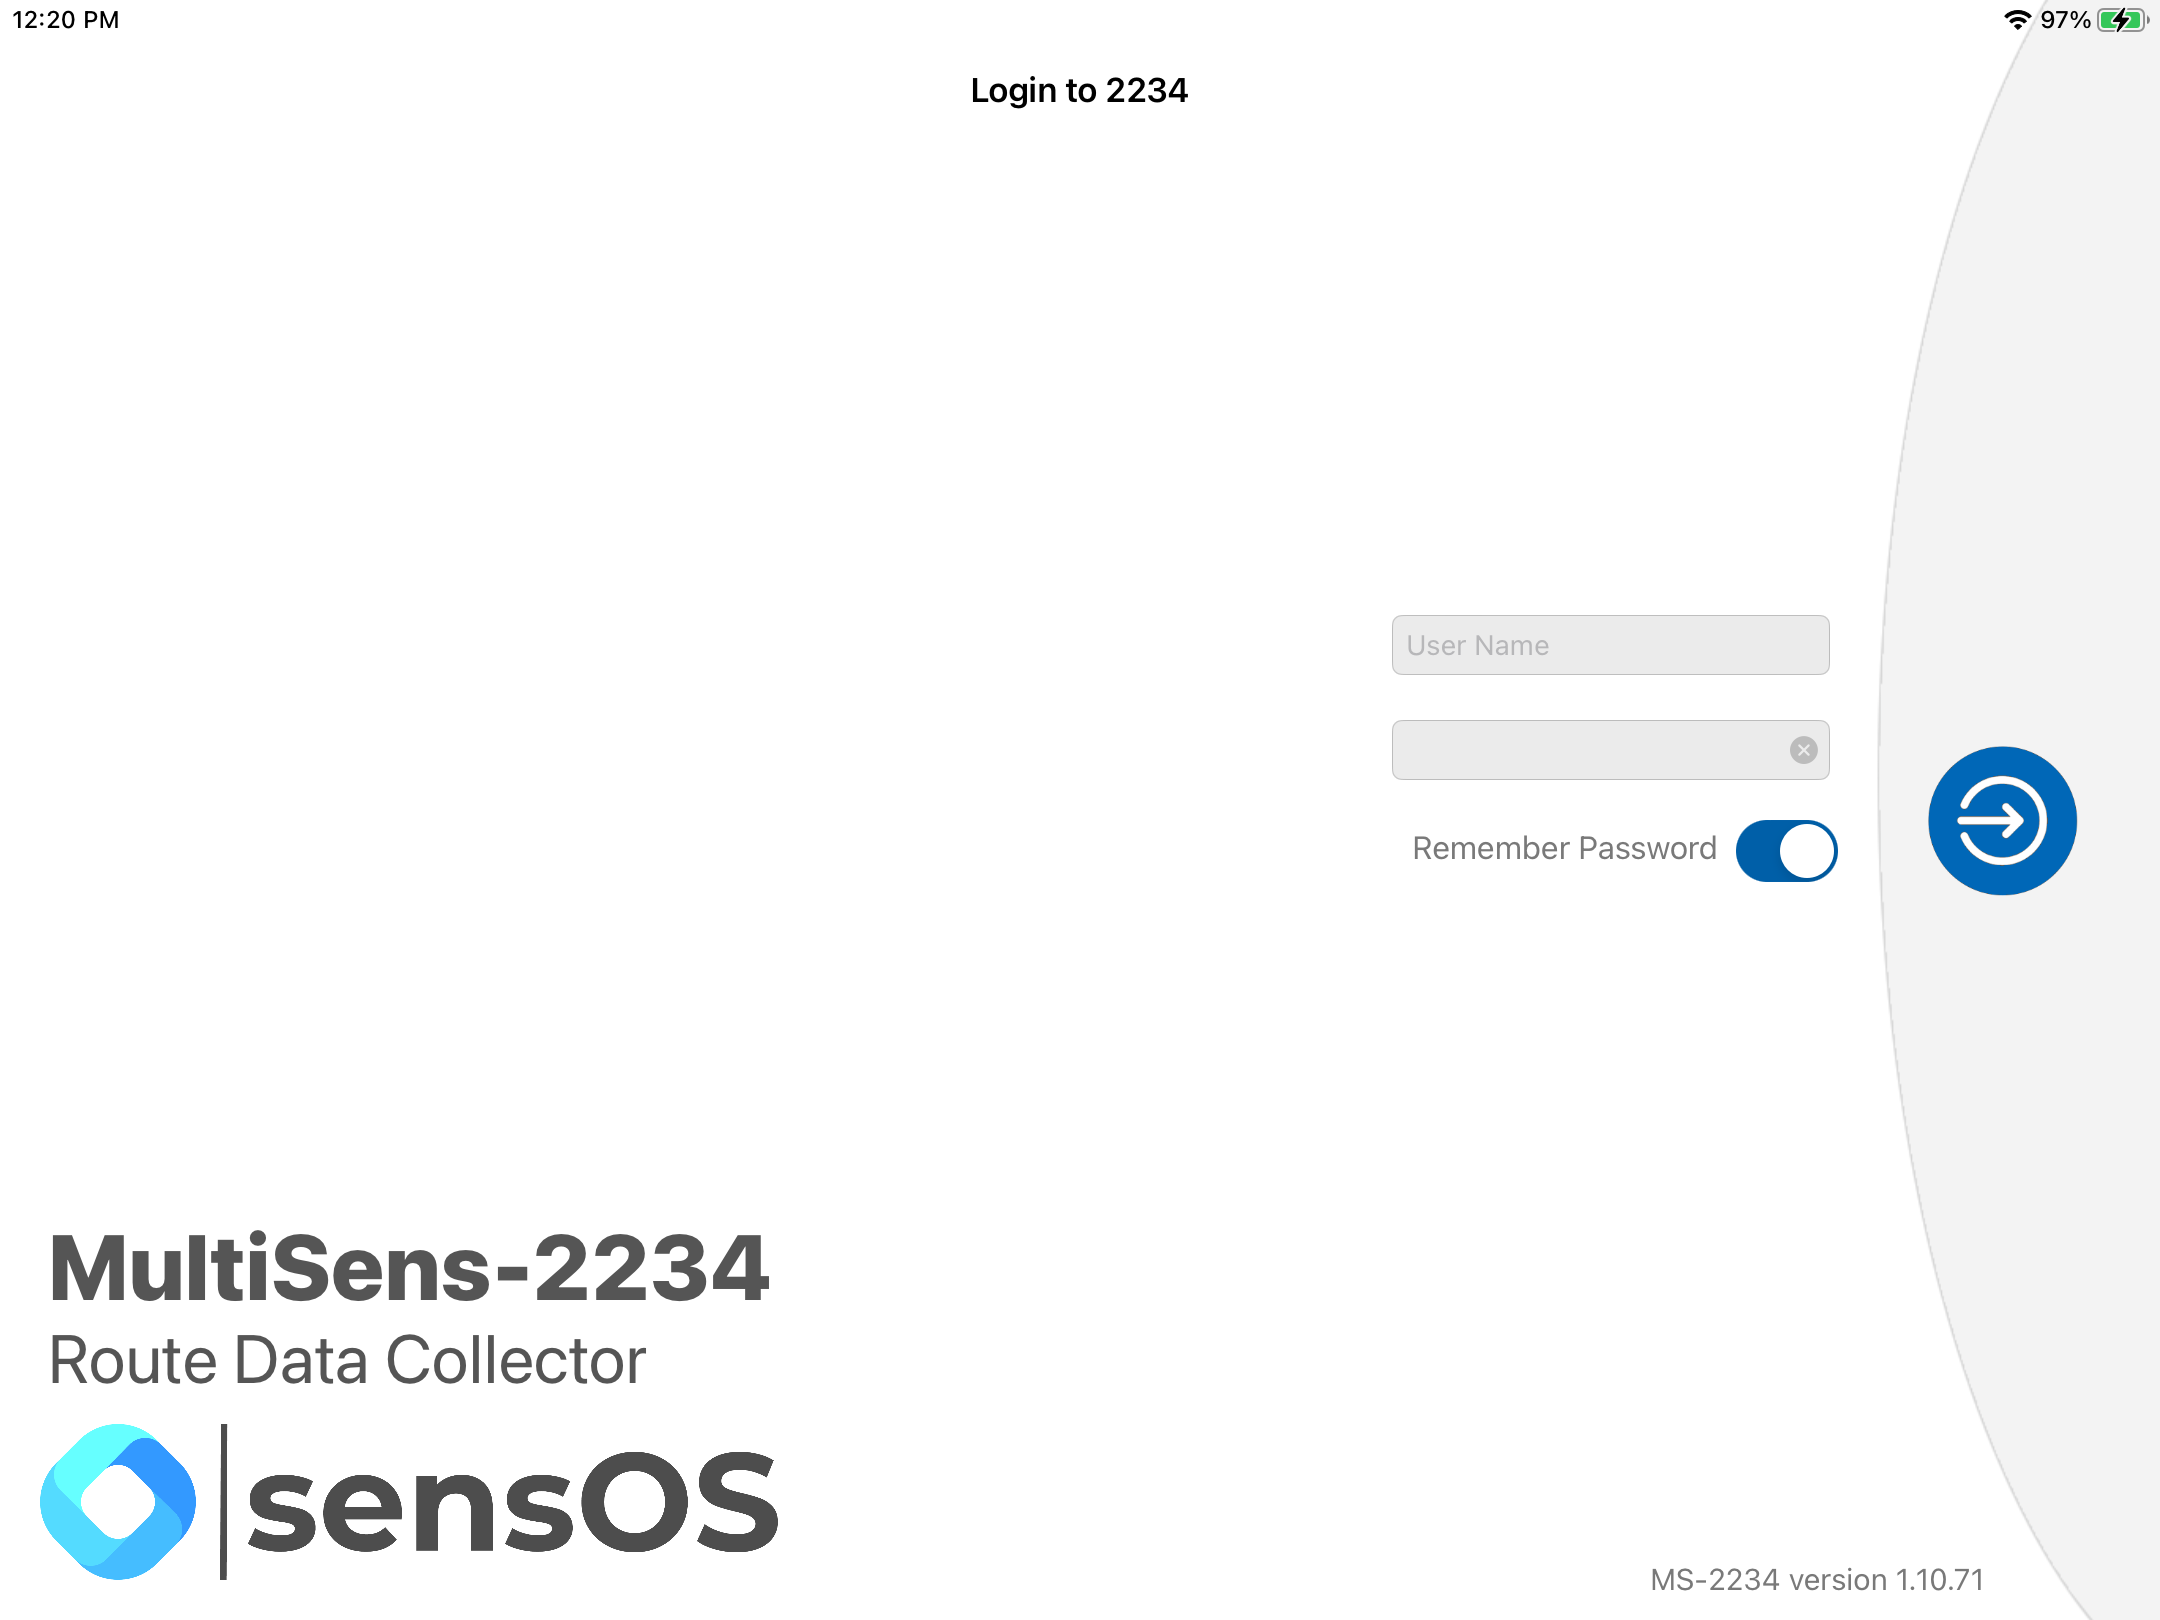
- Open the MS-2234 App and login (the first login will require Internet connectivity). Once the user is logged in for the first time the credentials will be stored in the device if the "Remember Password" switch is set to ON. After this, user can log in with or without Internet connectivity.
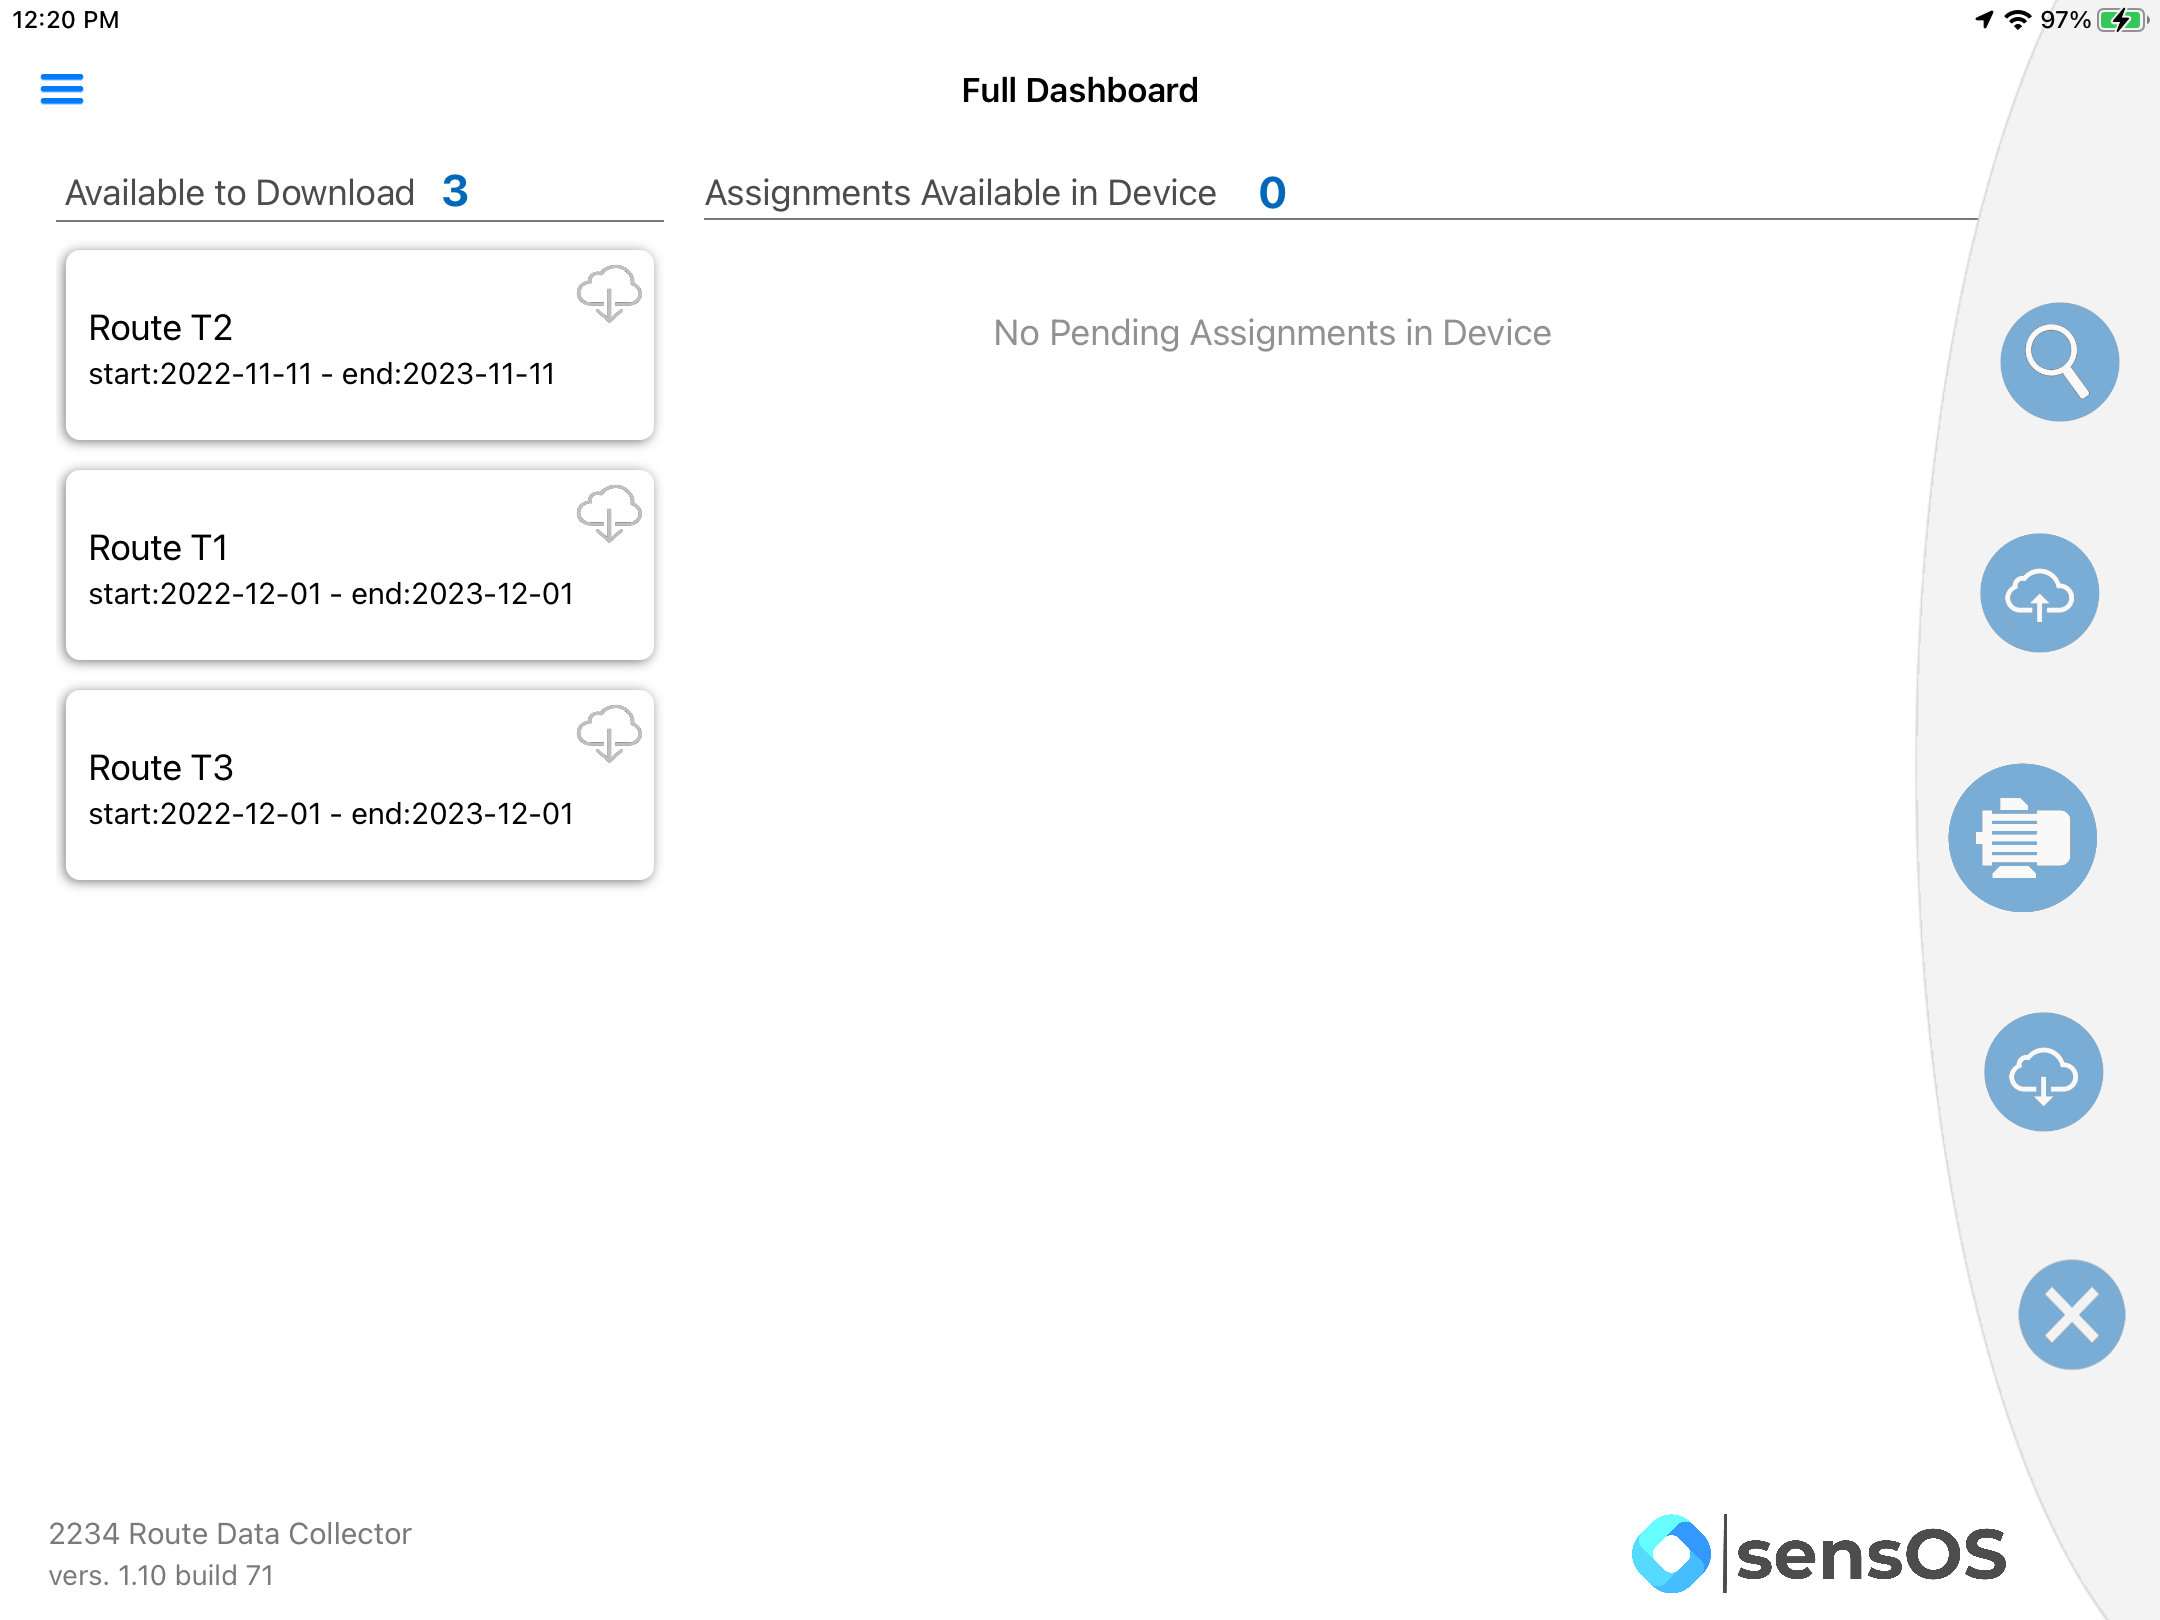
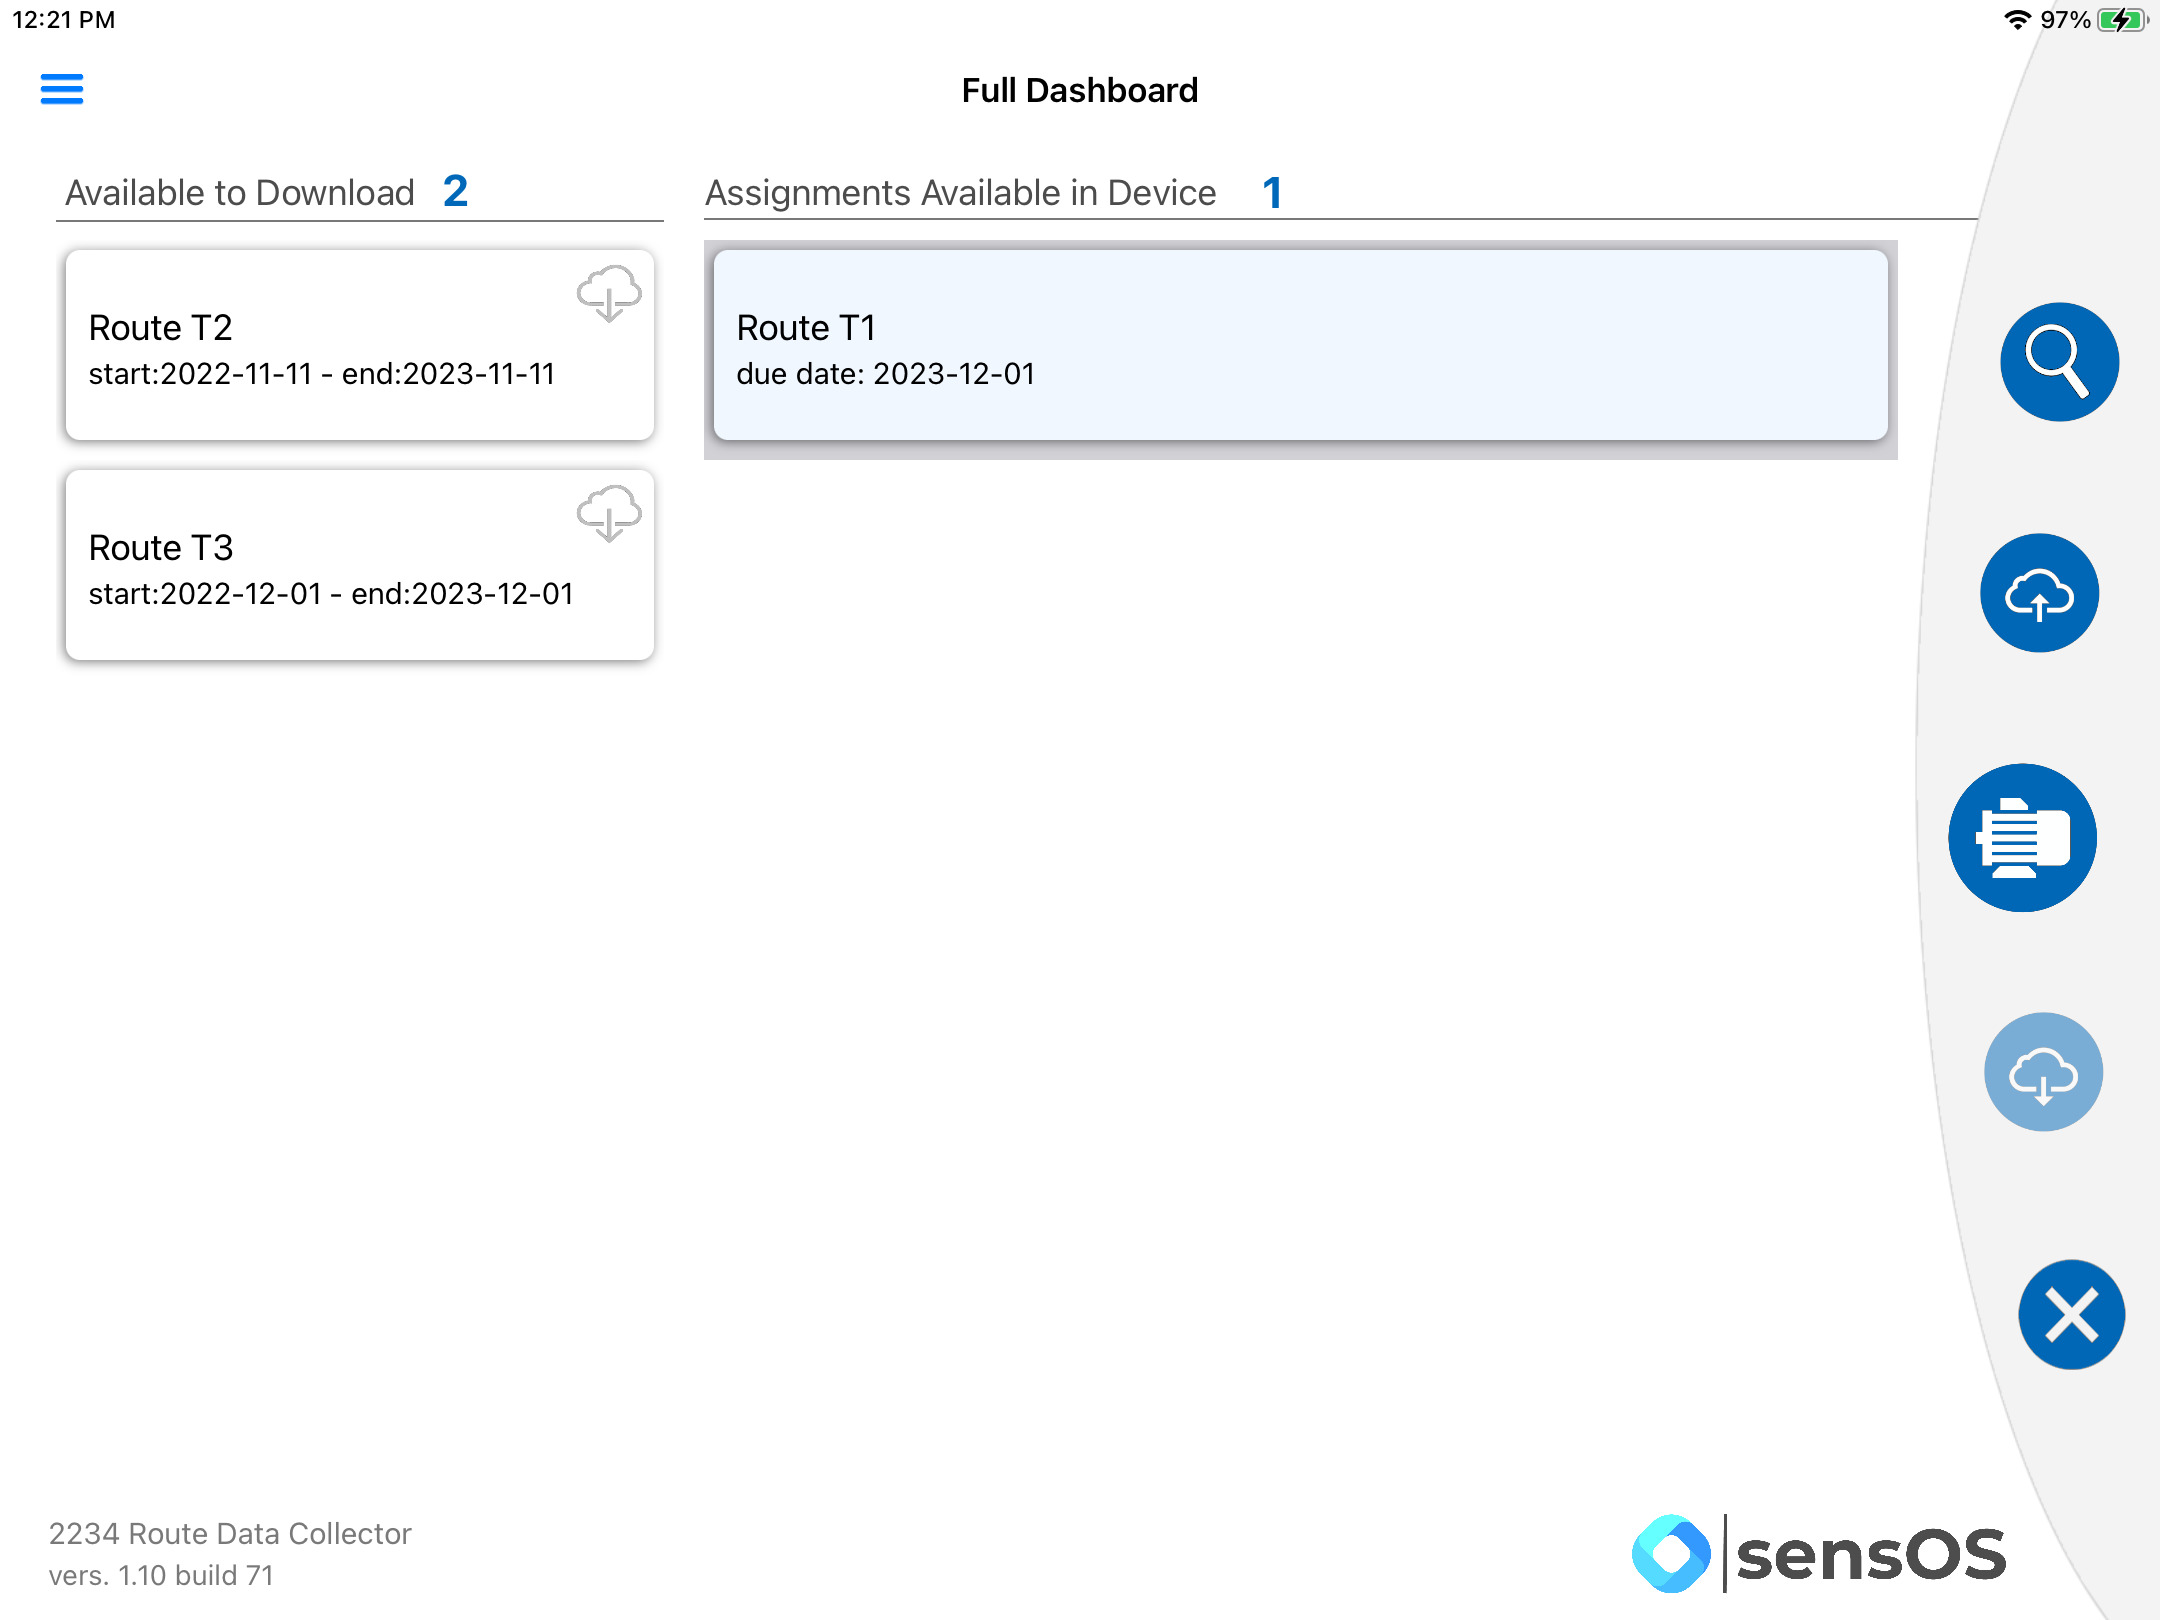
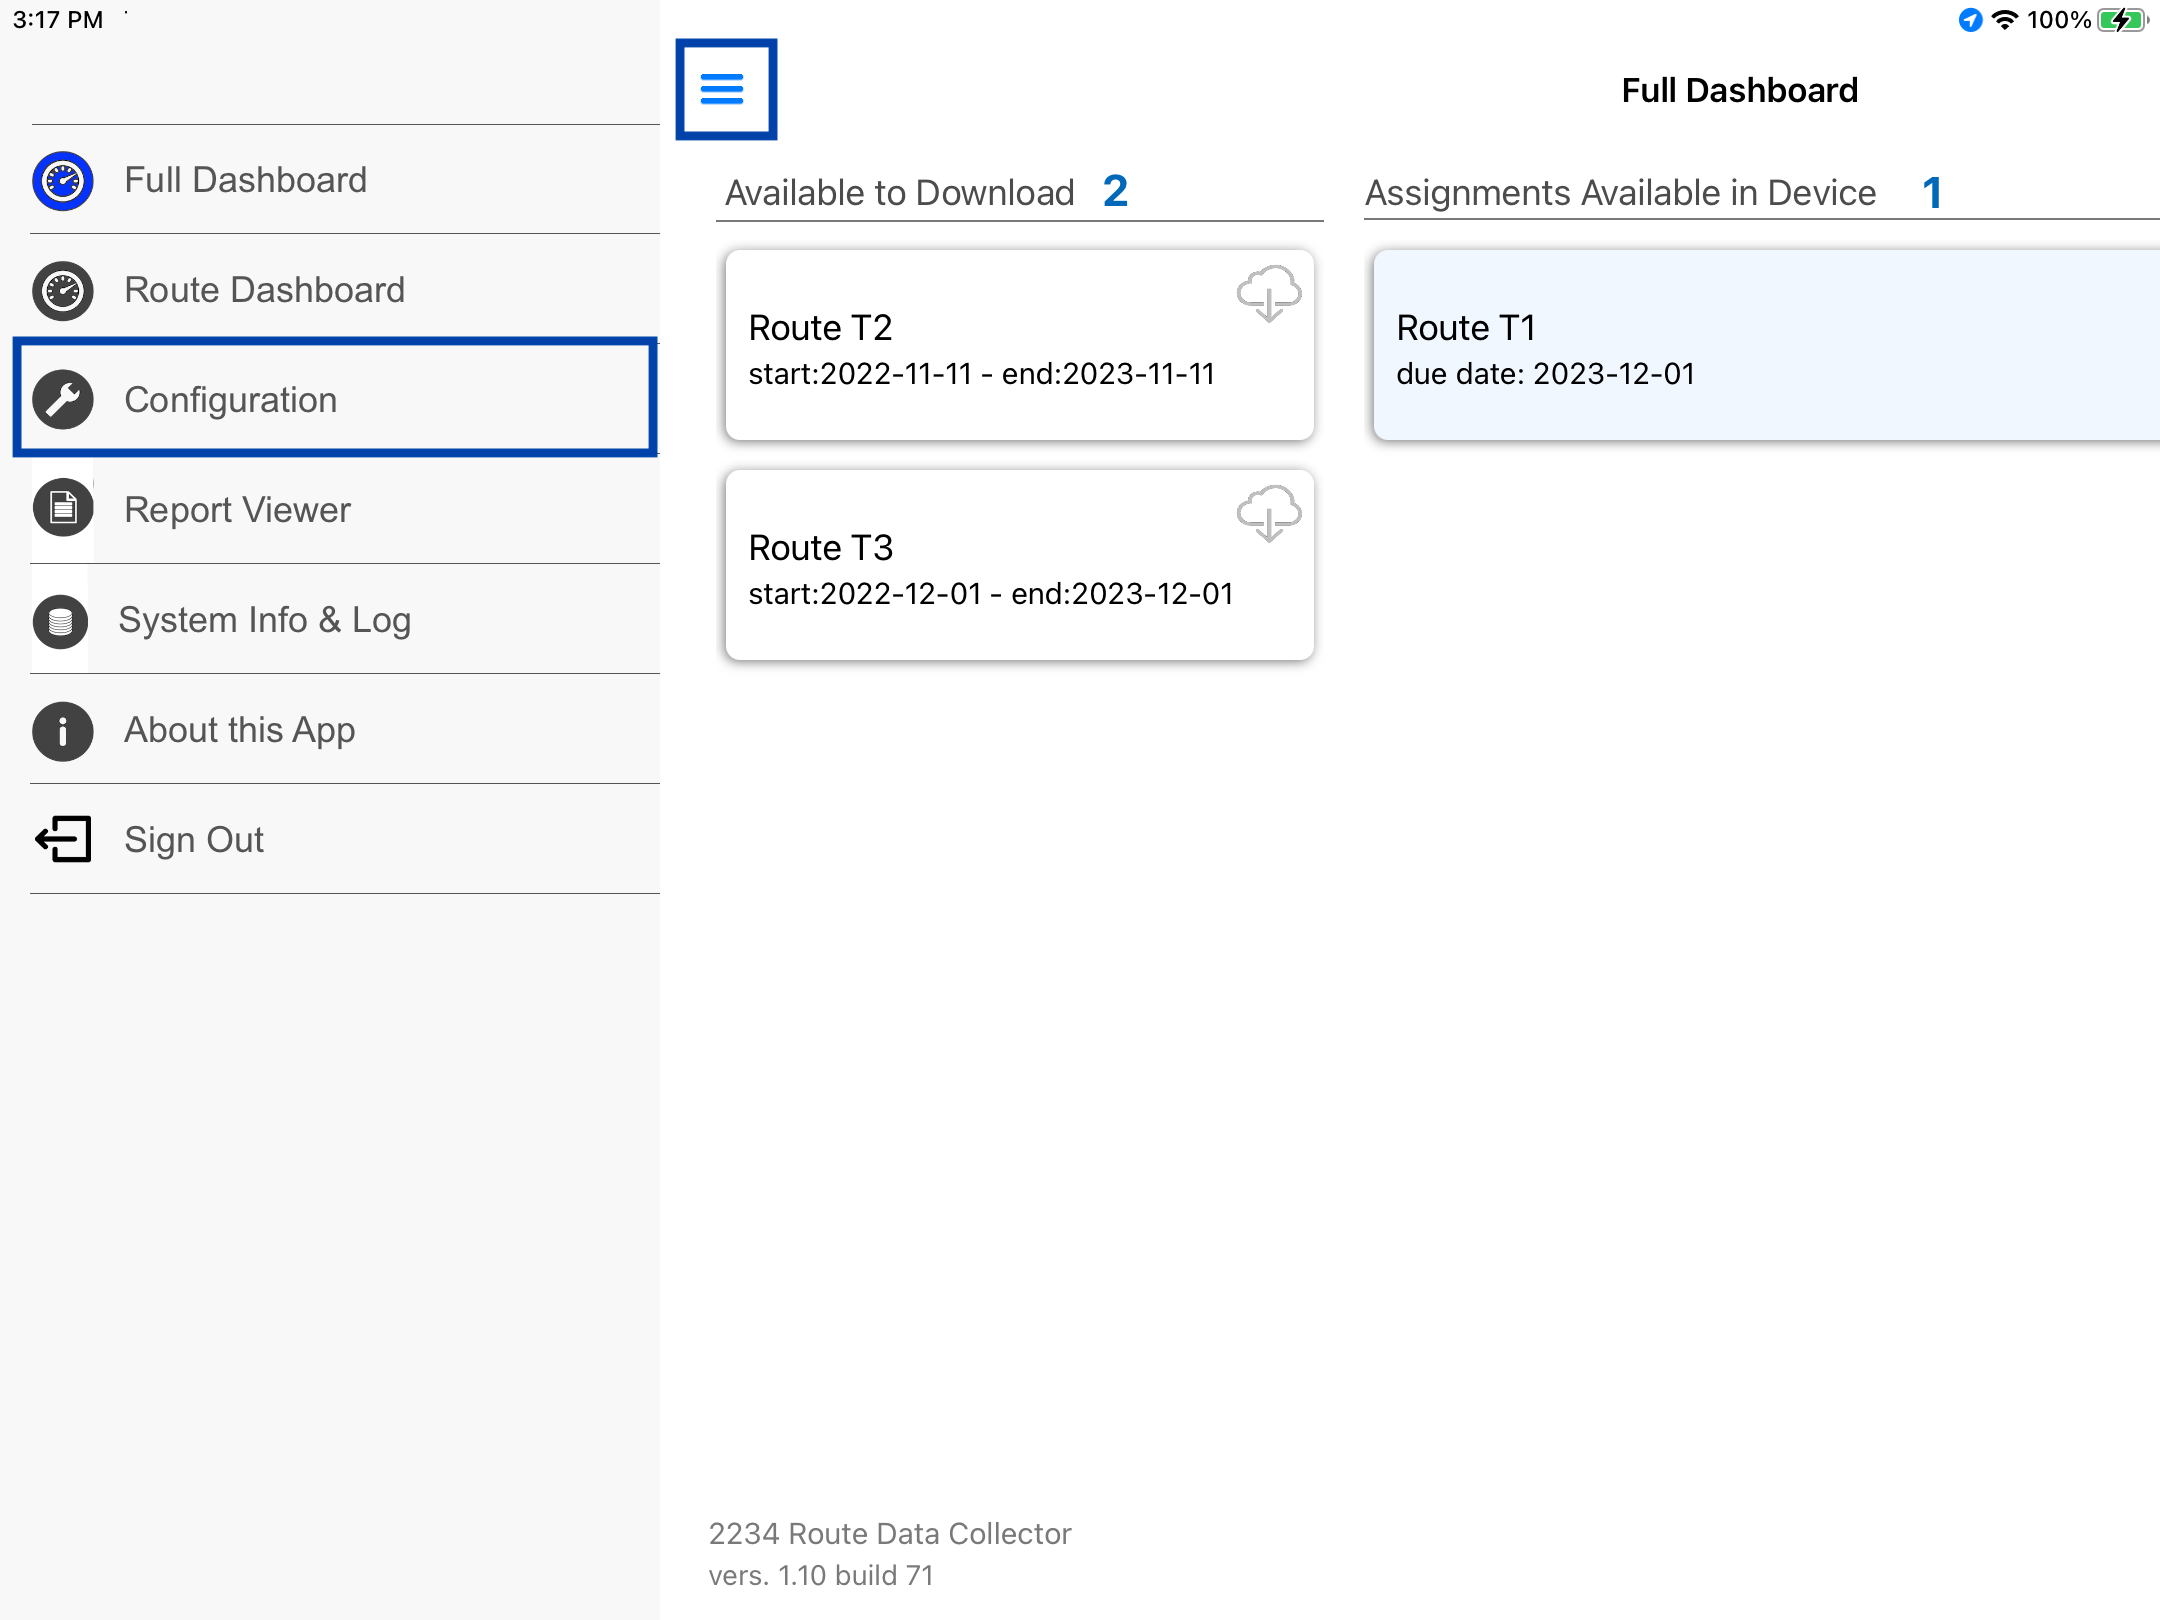
- Once a Route is created in the MS-Cloud platform it will be available to download in the tablet. Make sure the tablet is connected to the Internet for this process. Available routes in the cloud will show on the left side of the screen.
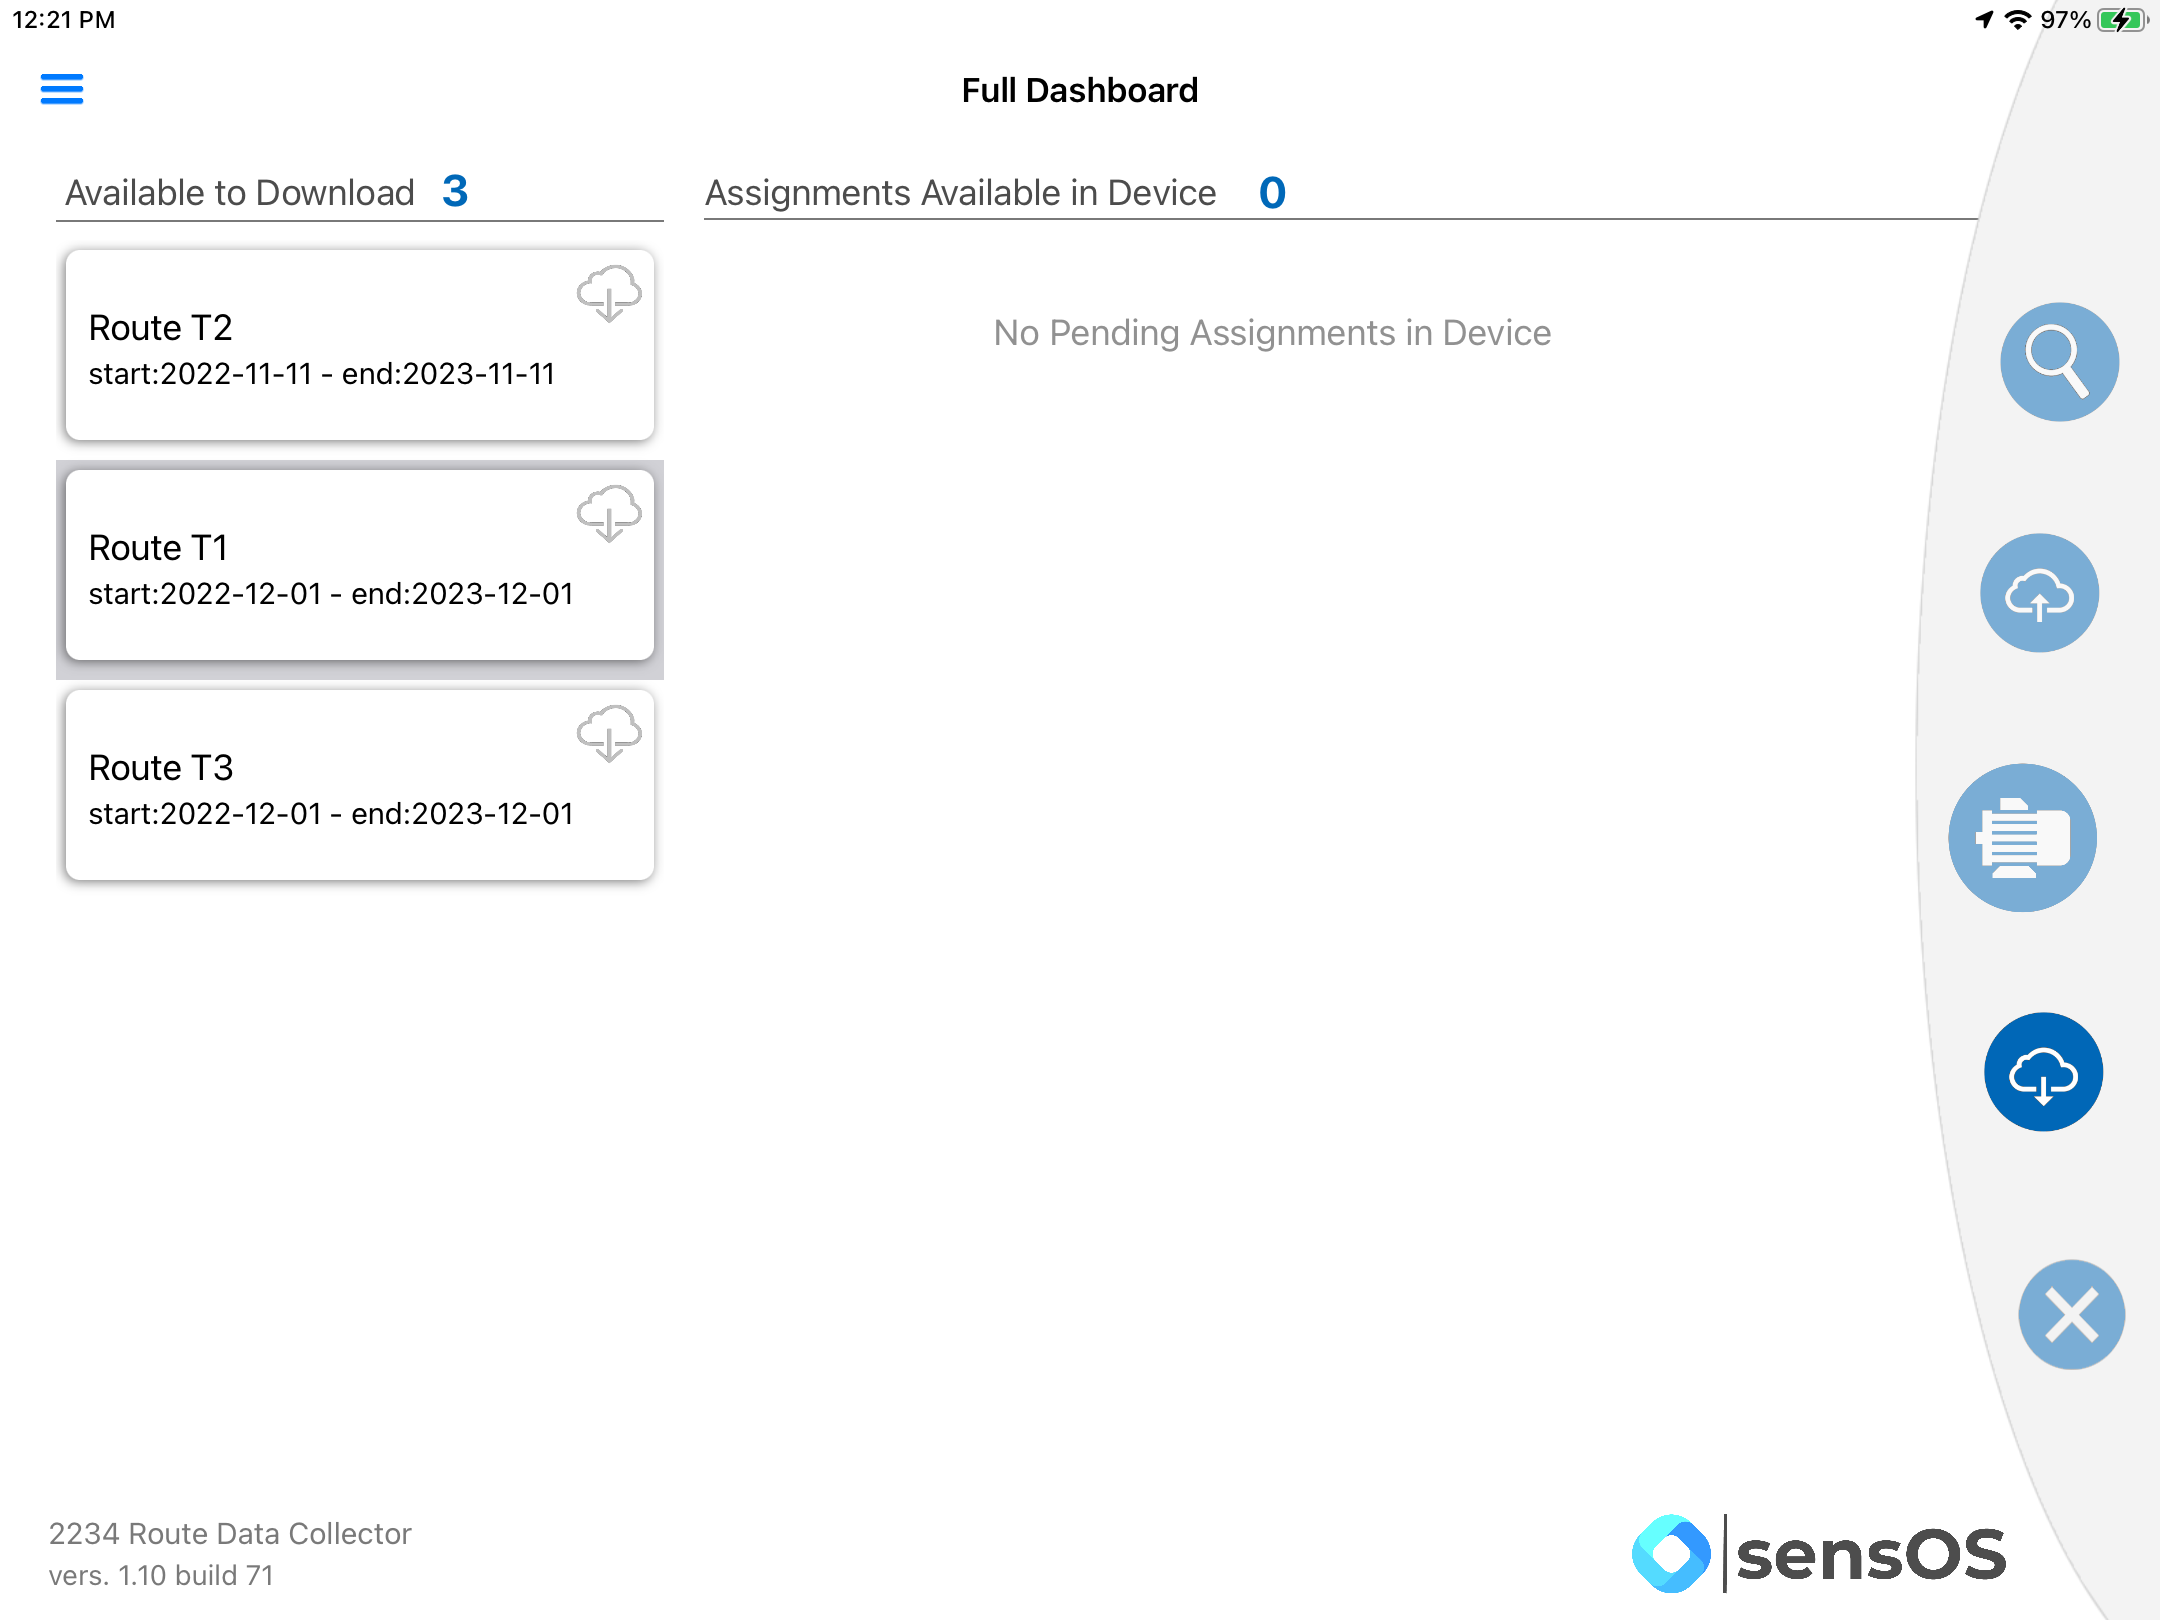
- Tap on a route to select it, on the right panel options the download button will be now enabled, as shown below. Click on the "Download from Cloud" button, the selected route will be downloaded in the device.
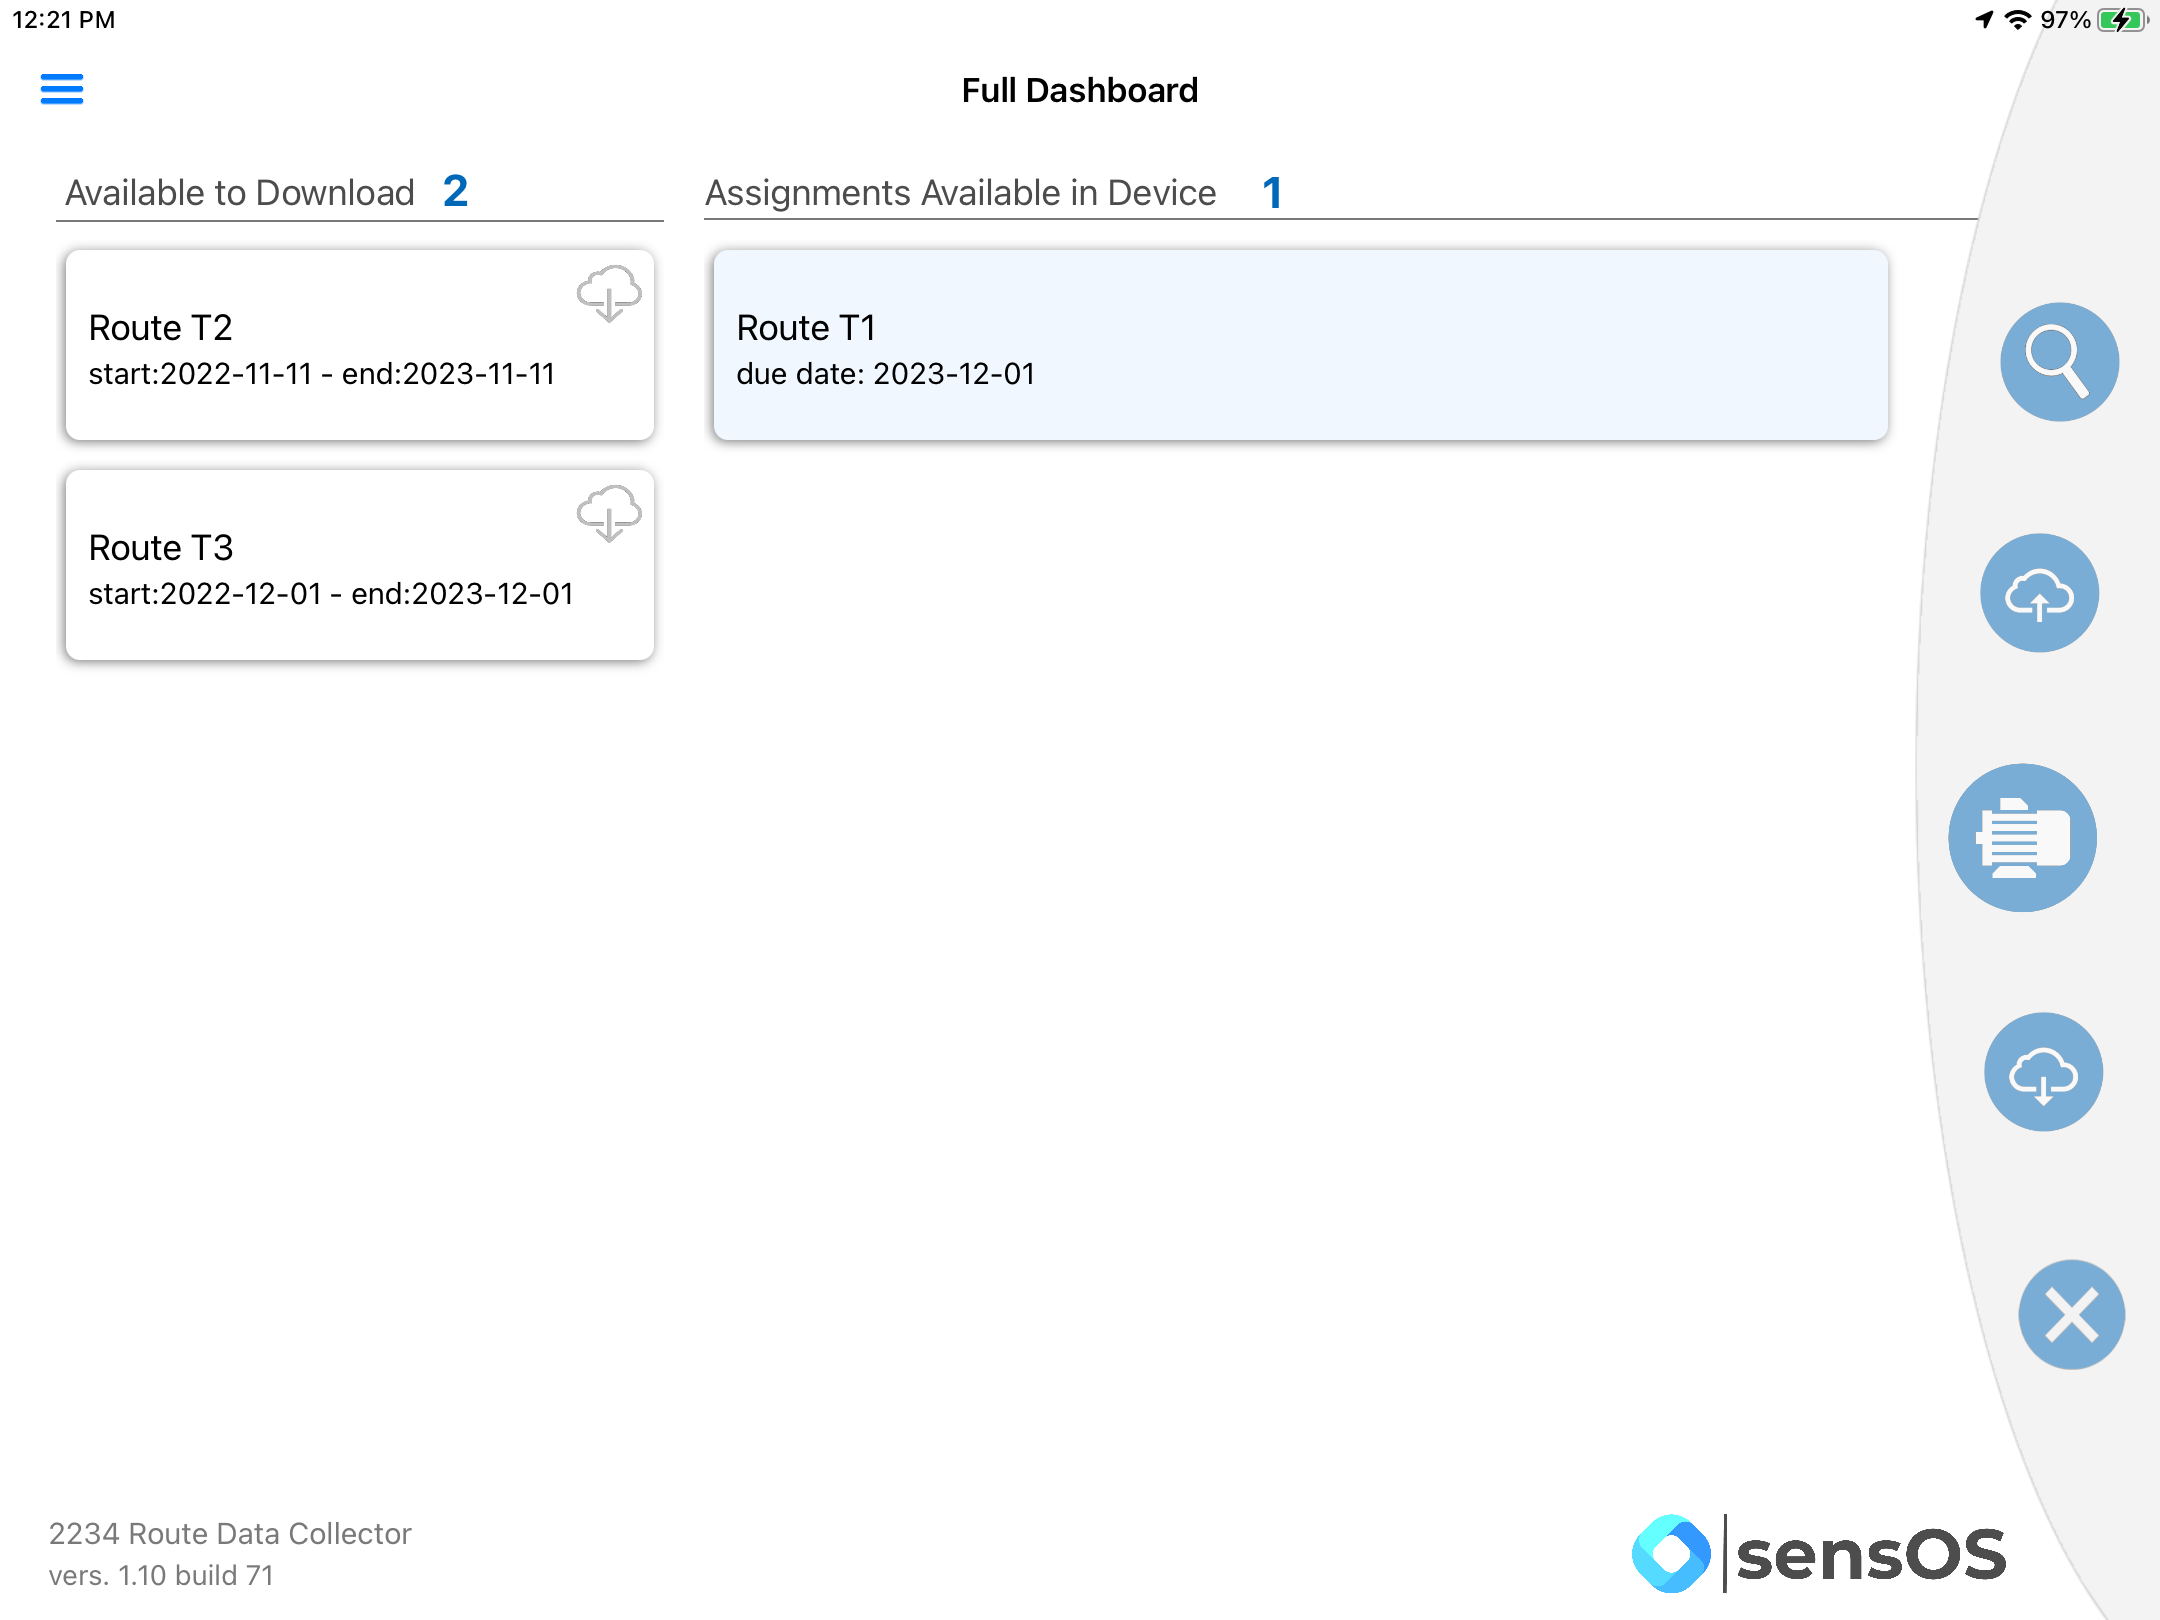
- Once the route is downloaded it will appear on the right side of the screen be remain local in the device, during data collection Internet connectivity will not be required.
- Tap on the downloaded routes to select one, the right panel buttons (view, upload, collect and remove) will be enabled
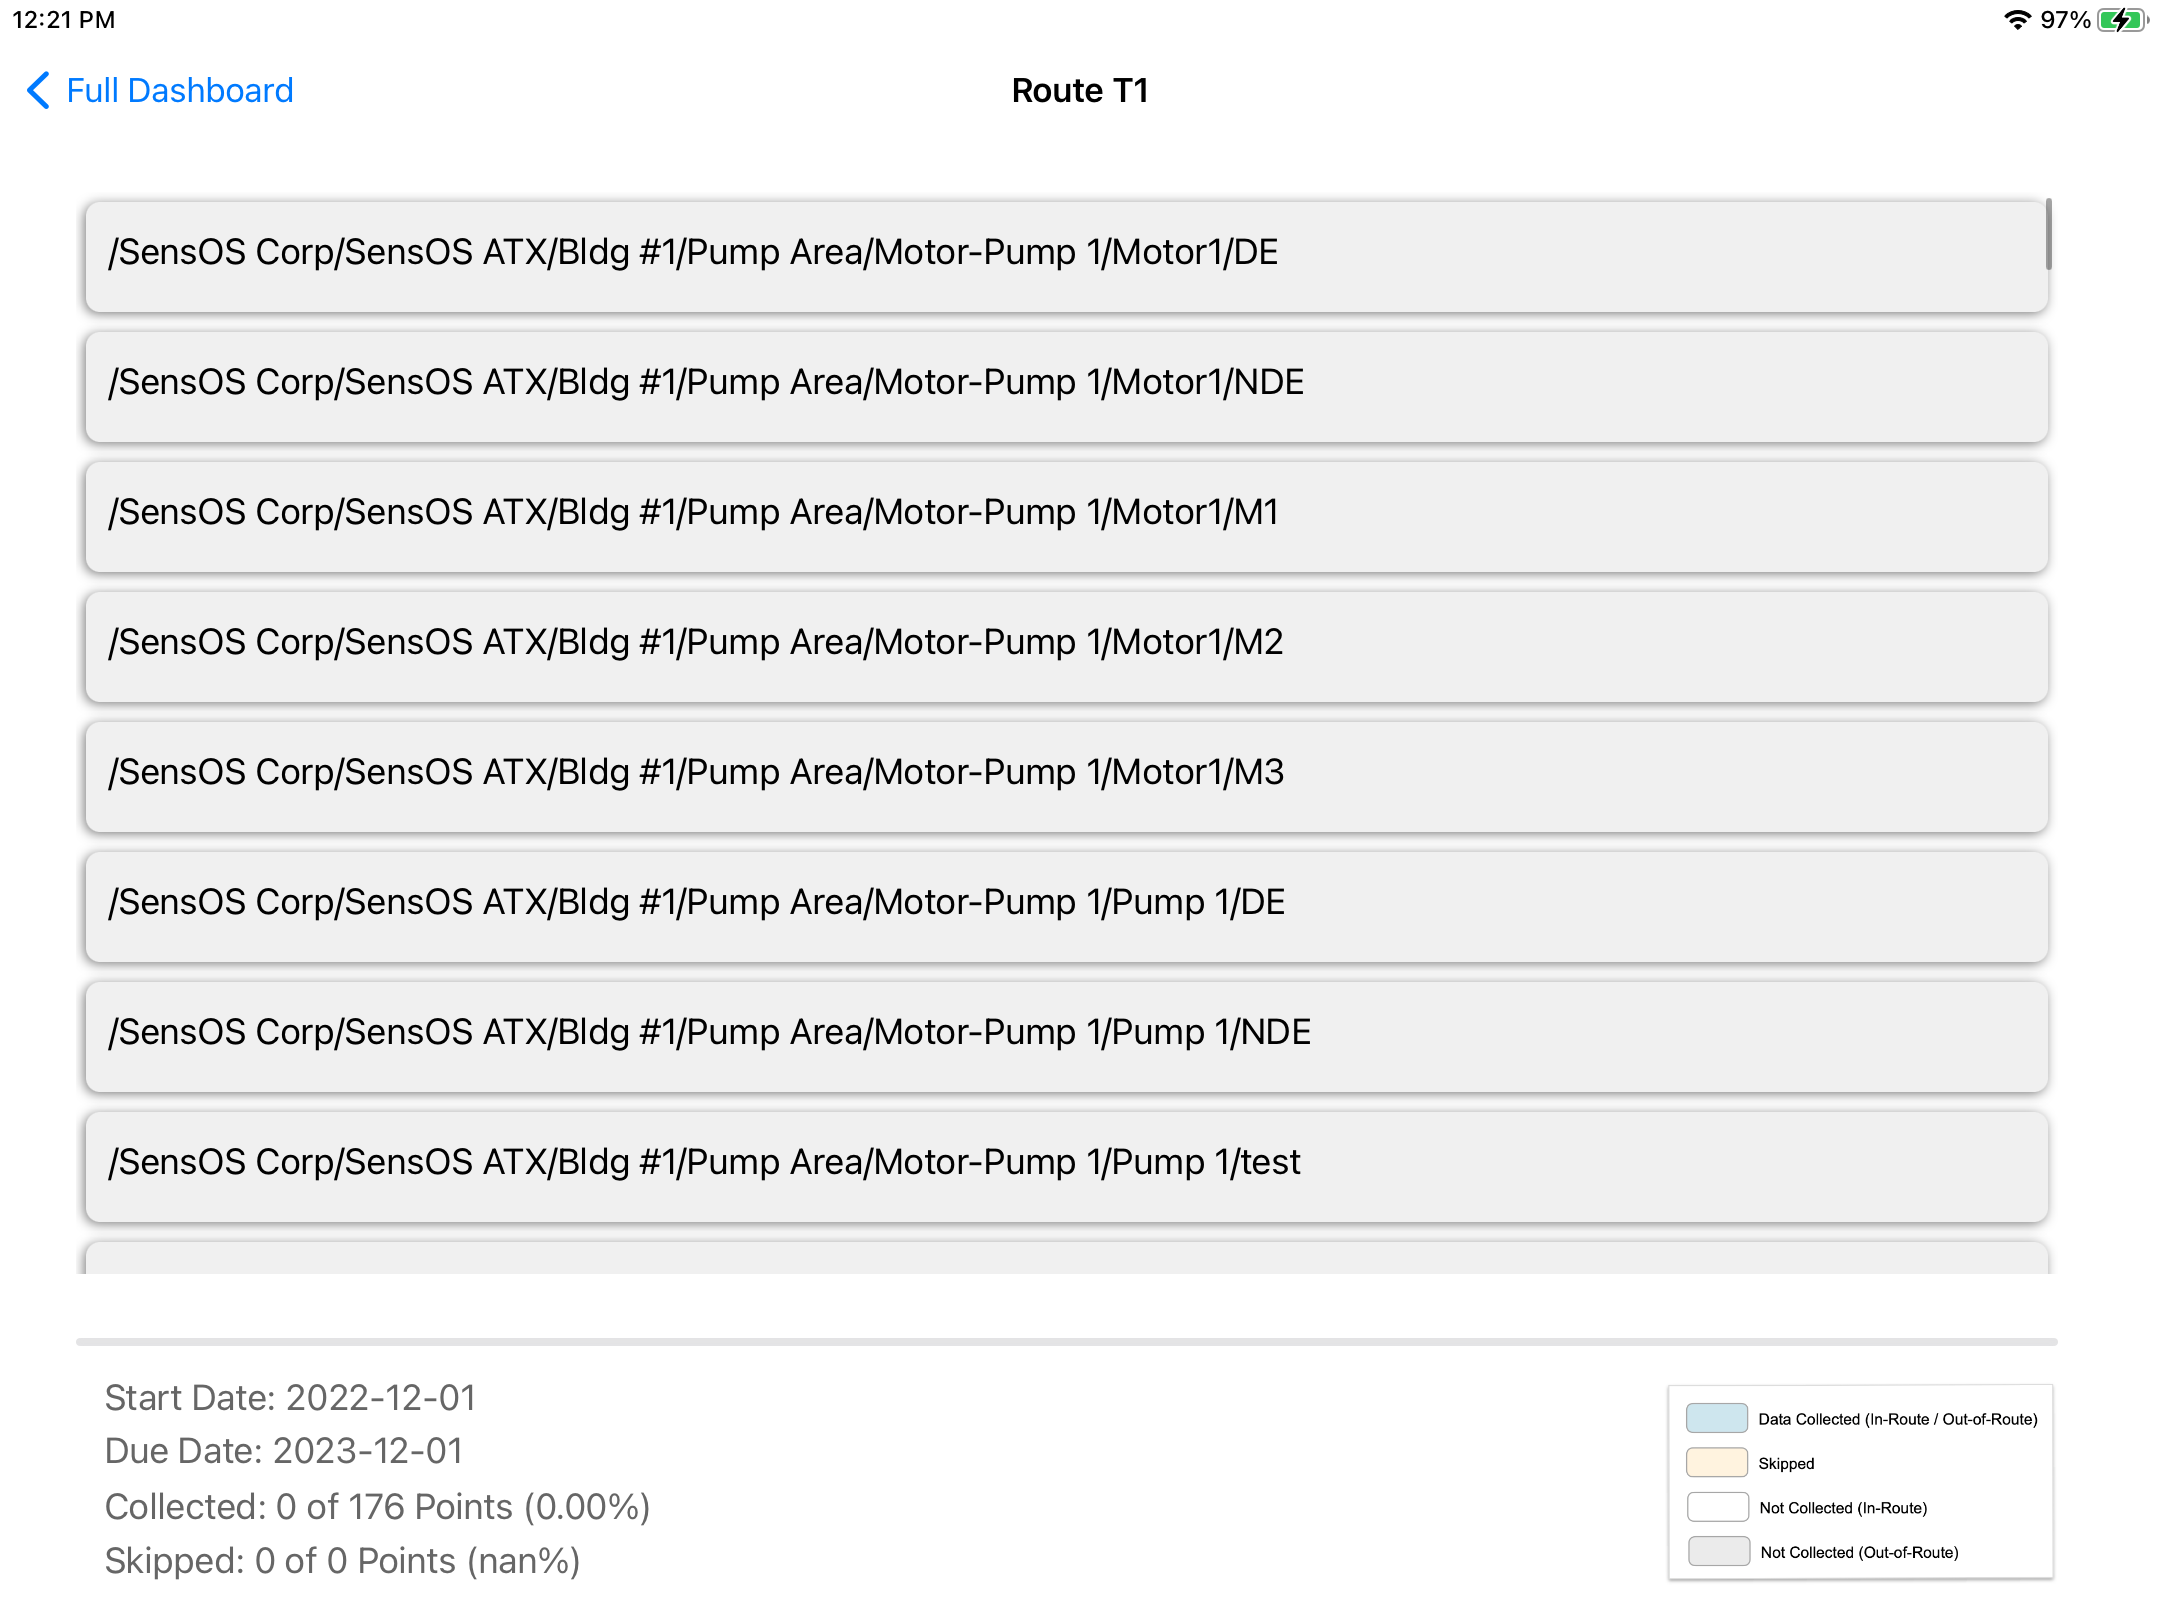
- Pressing the View (magnifier icon) button in the right panel (previous screenshot), will open a view showing all the points in the selected route. A white background cell means the point is in the route, gray background is for off-route points. The cyan background indicates the point is already measured/collected. The view will also show the total number of points and completion percentage.
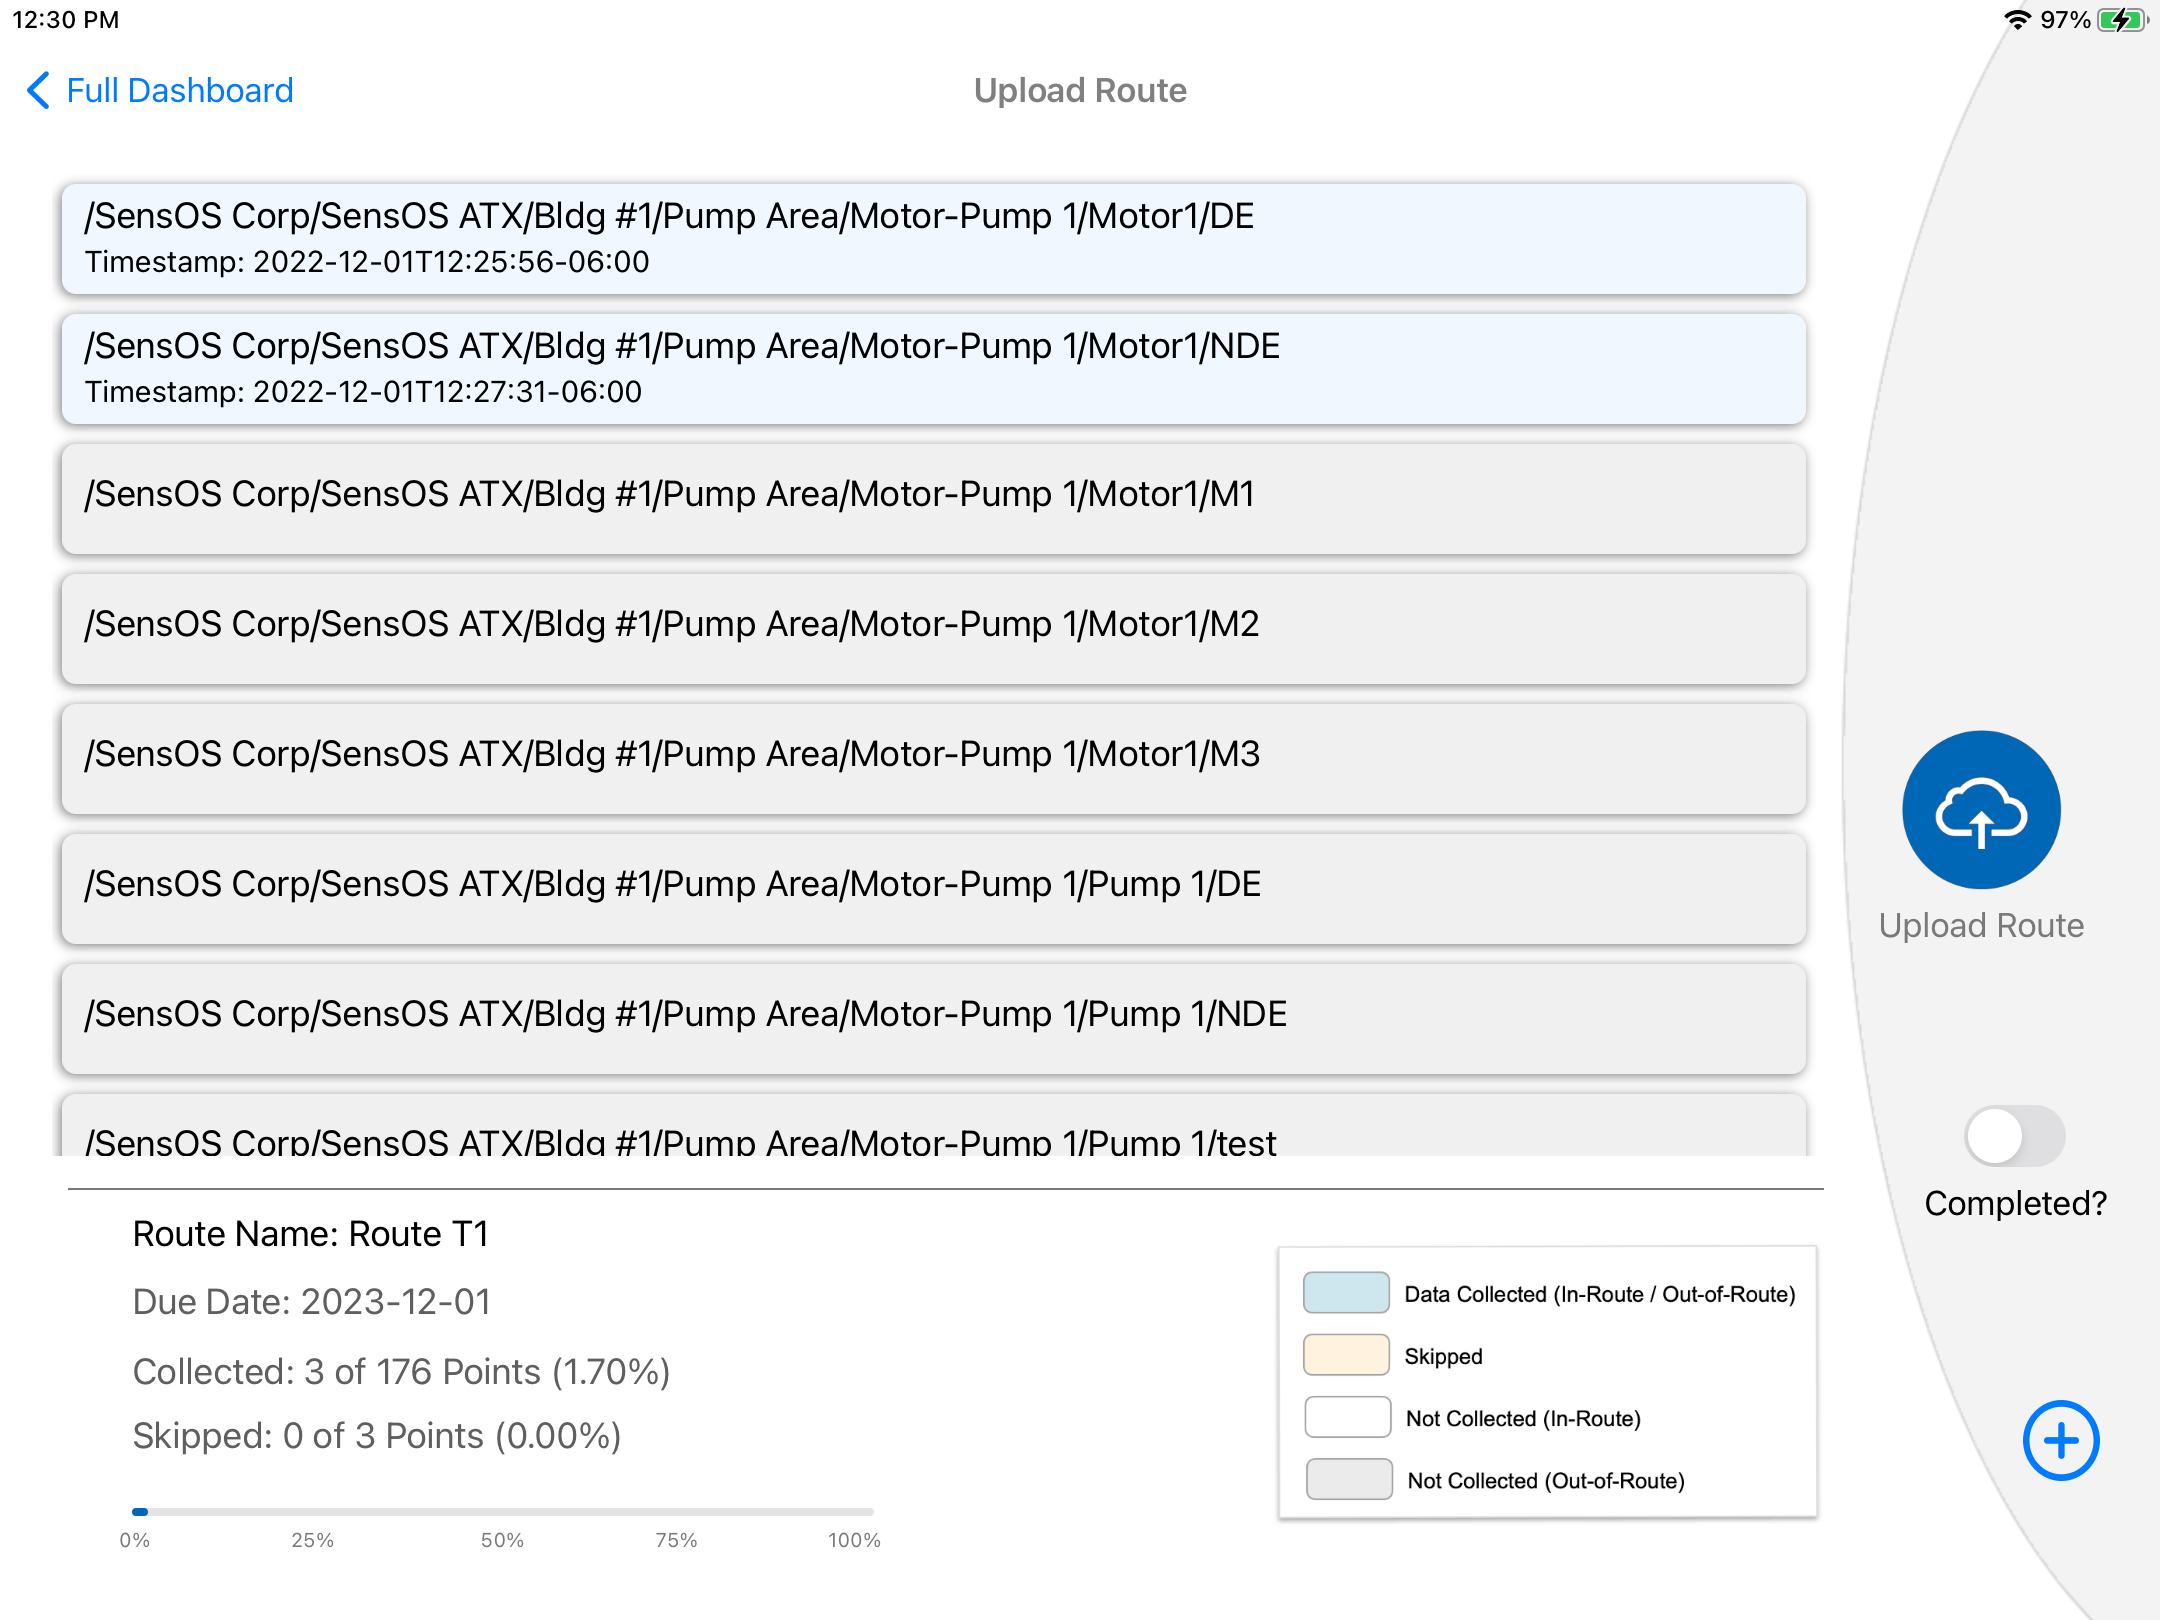
- Pressing the 'Upload to Cloud' button, will open a new view showing all the point status and with the option to upload all the collected data to the MS-Cloud. Pressing the Upload button in this view will send data to the cloud, the user can decide to leave the route (partial upload) or to remove the route after uploading.
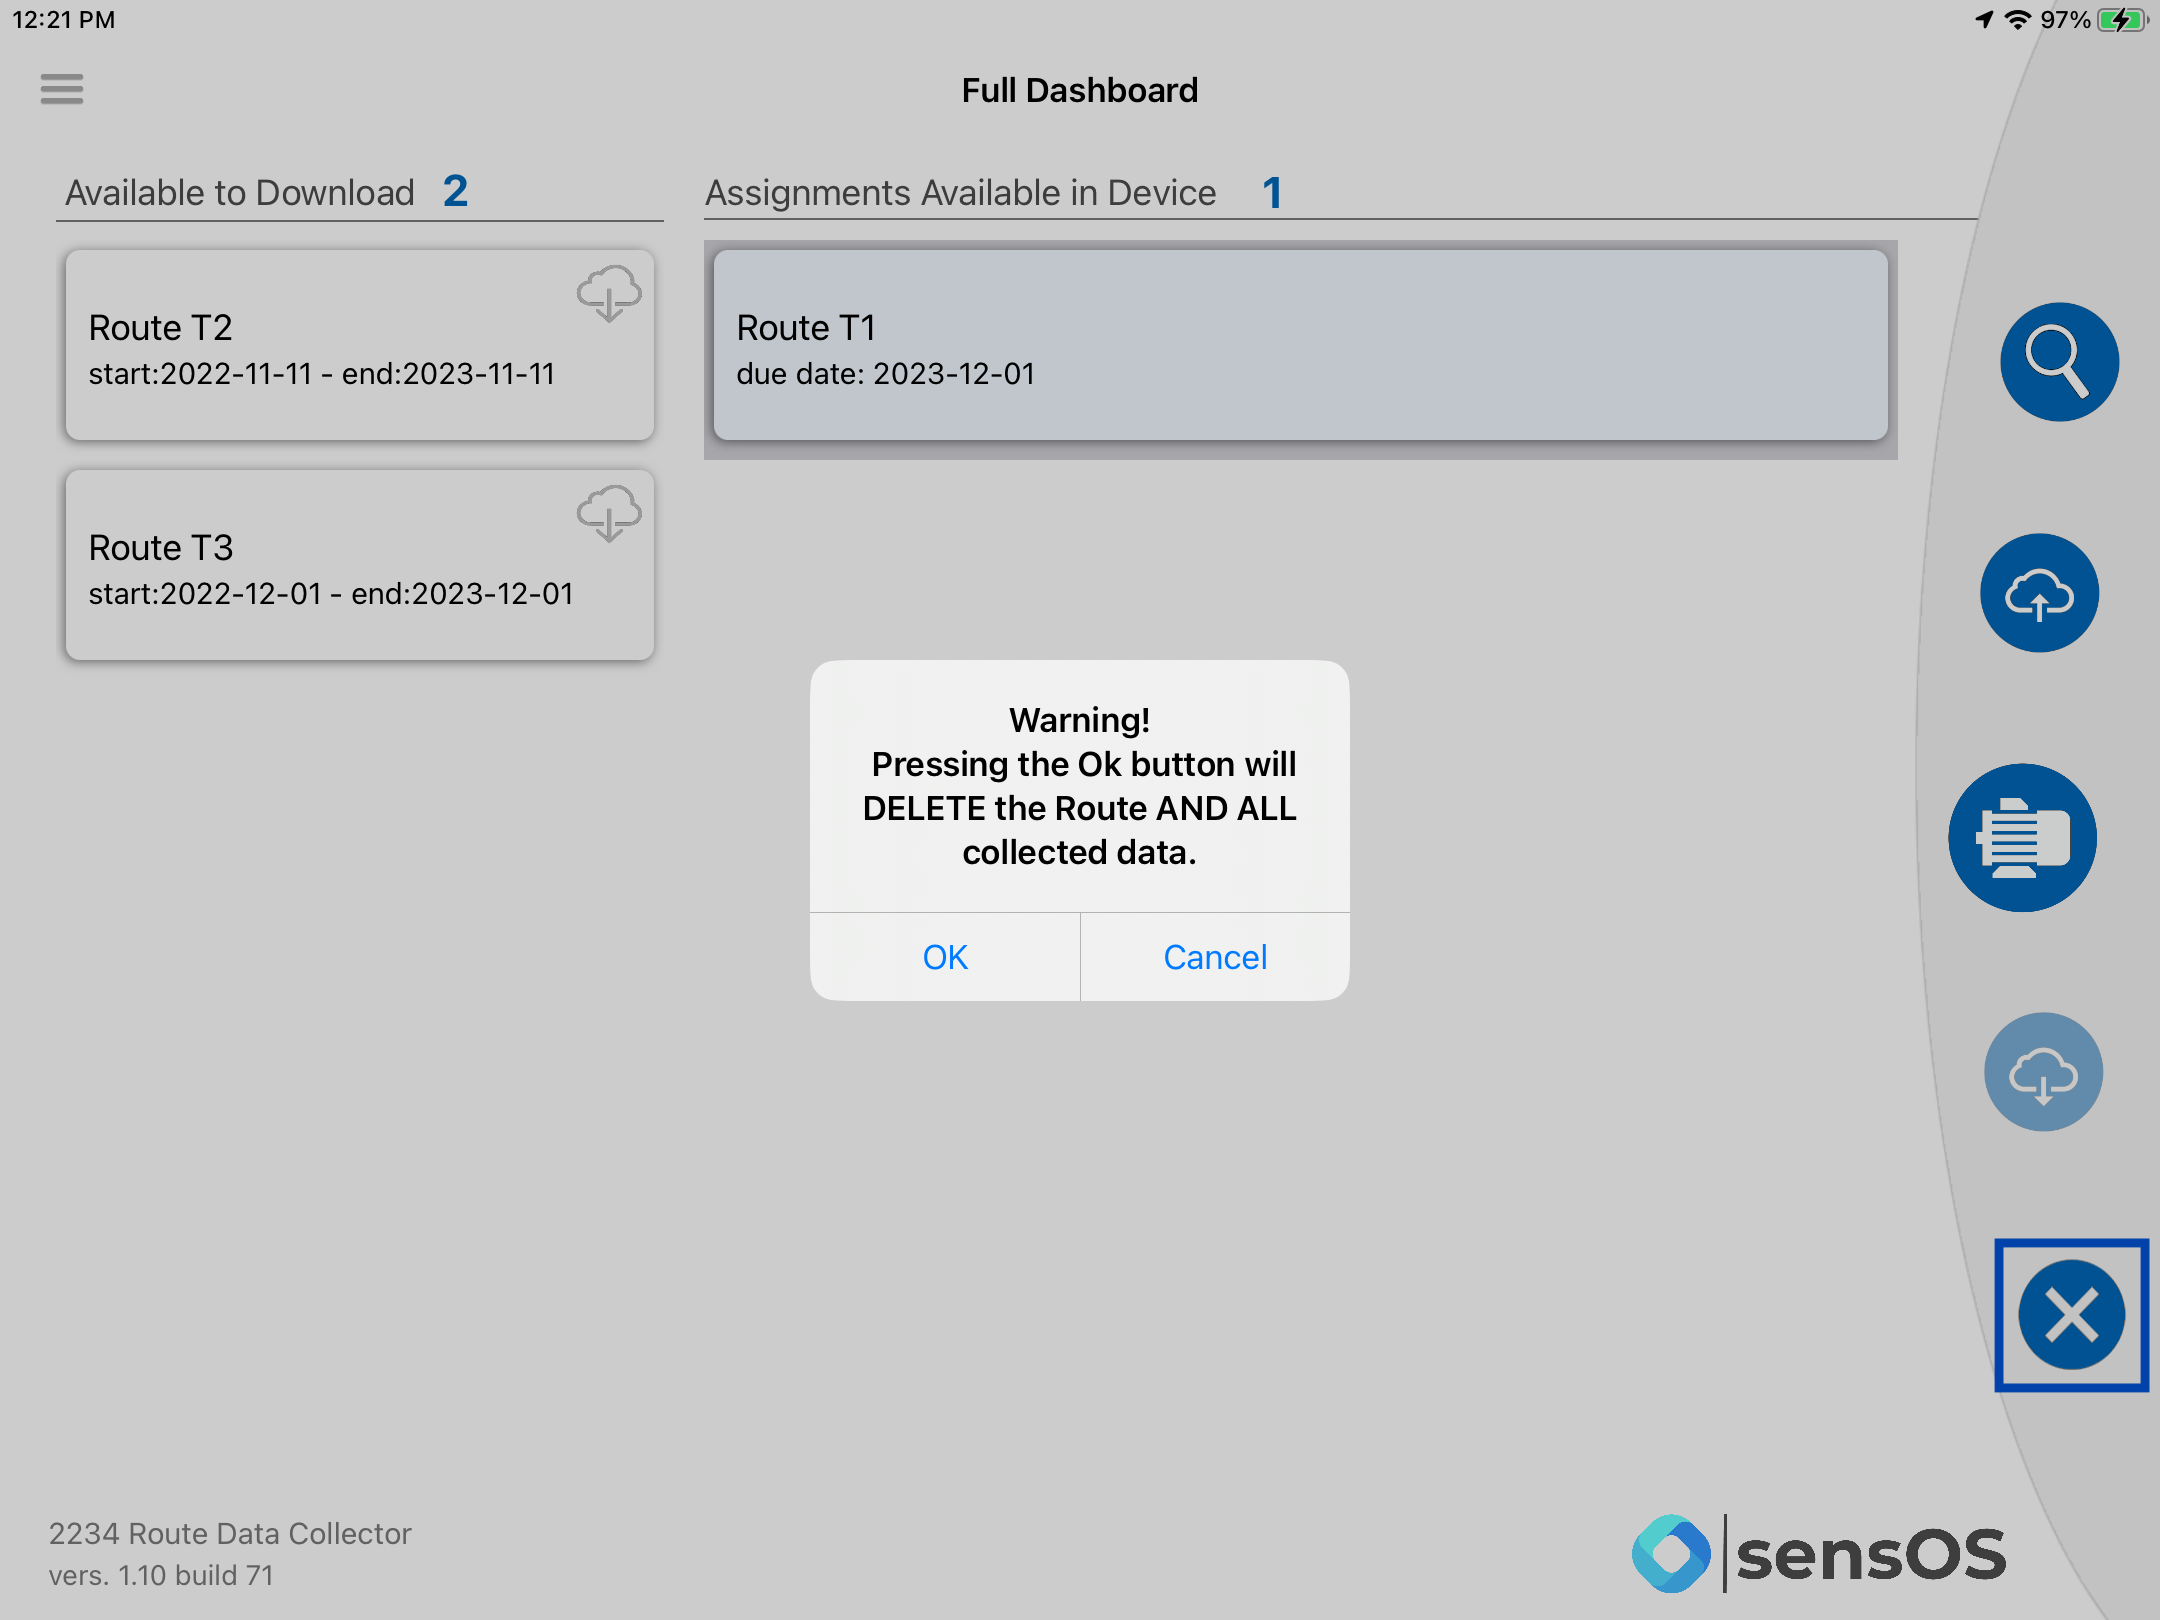
- Pressing the 'X' (remove) button, will remove the selected route from the device. The route will be available again to be downloaded but it will not be local anymore.
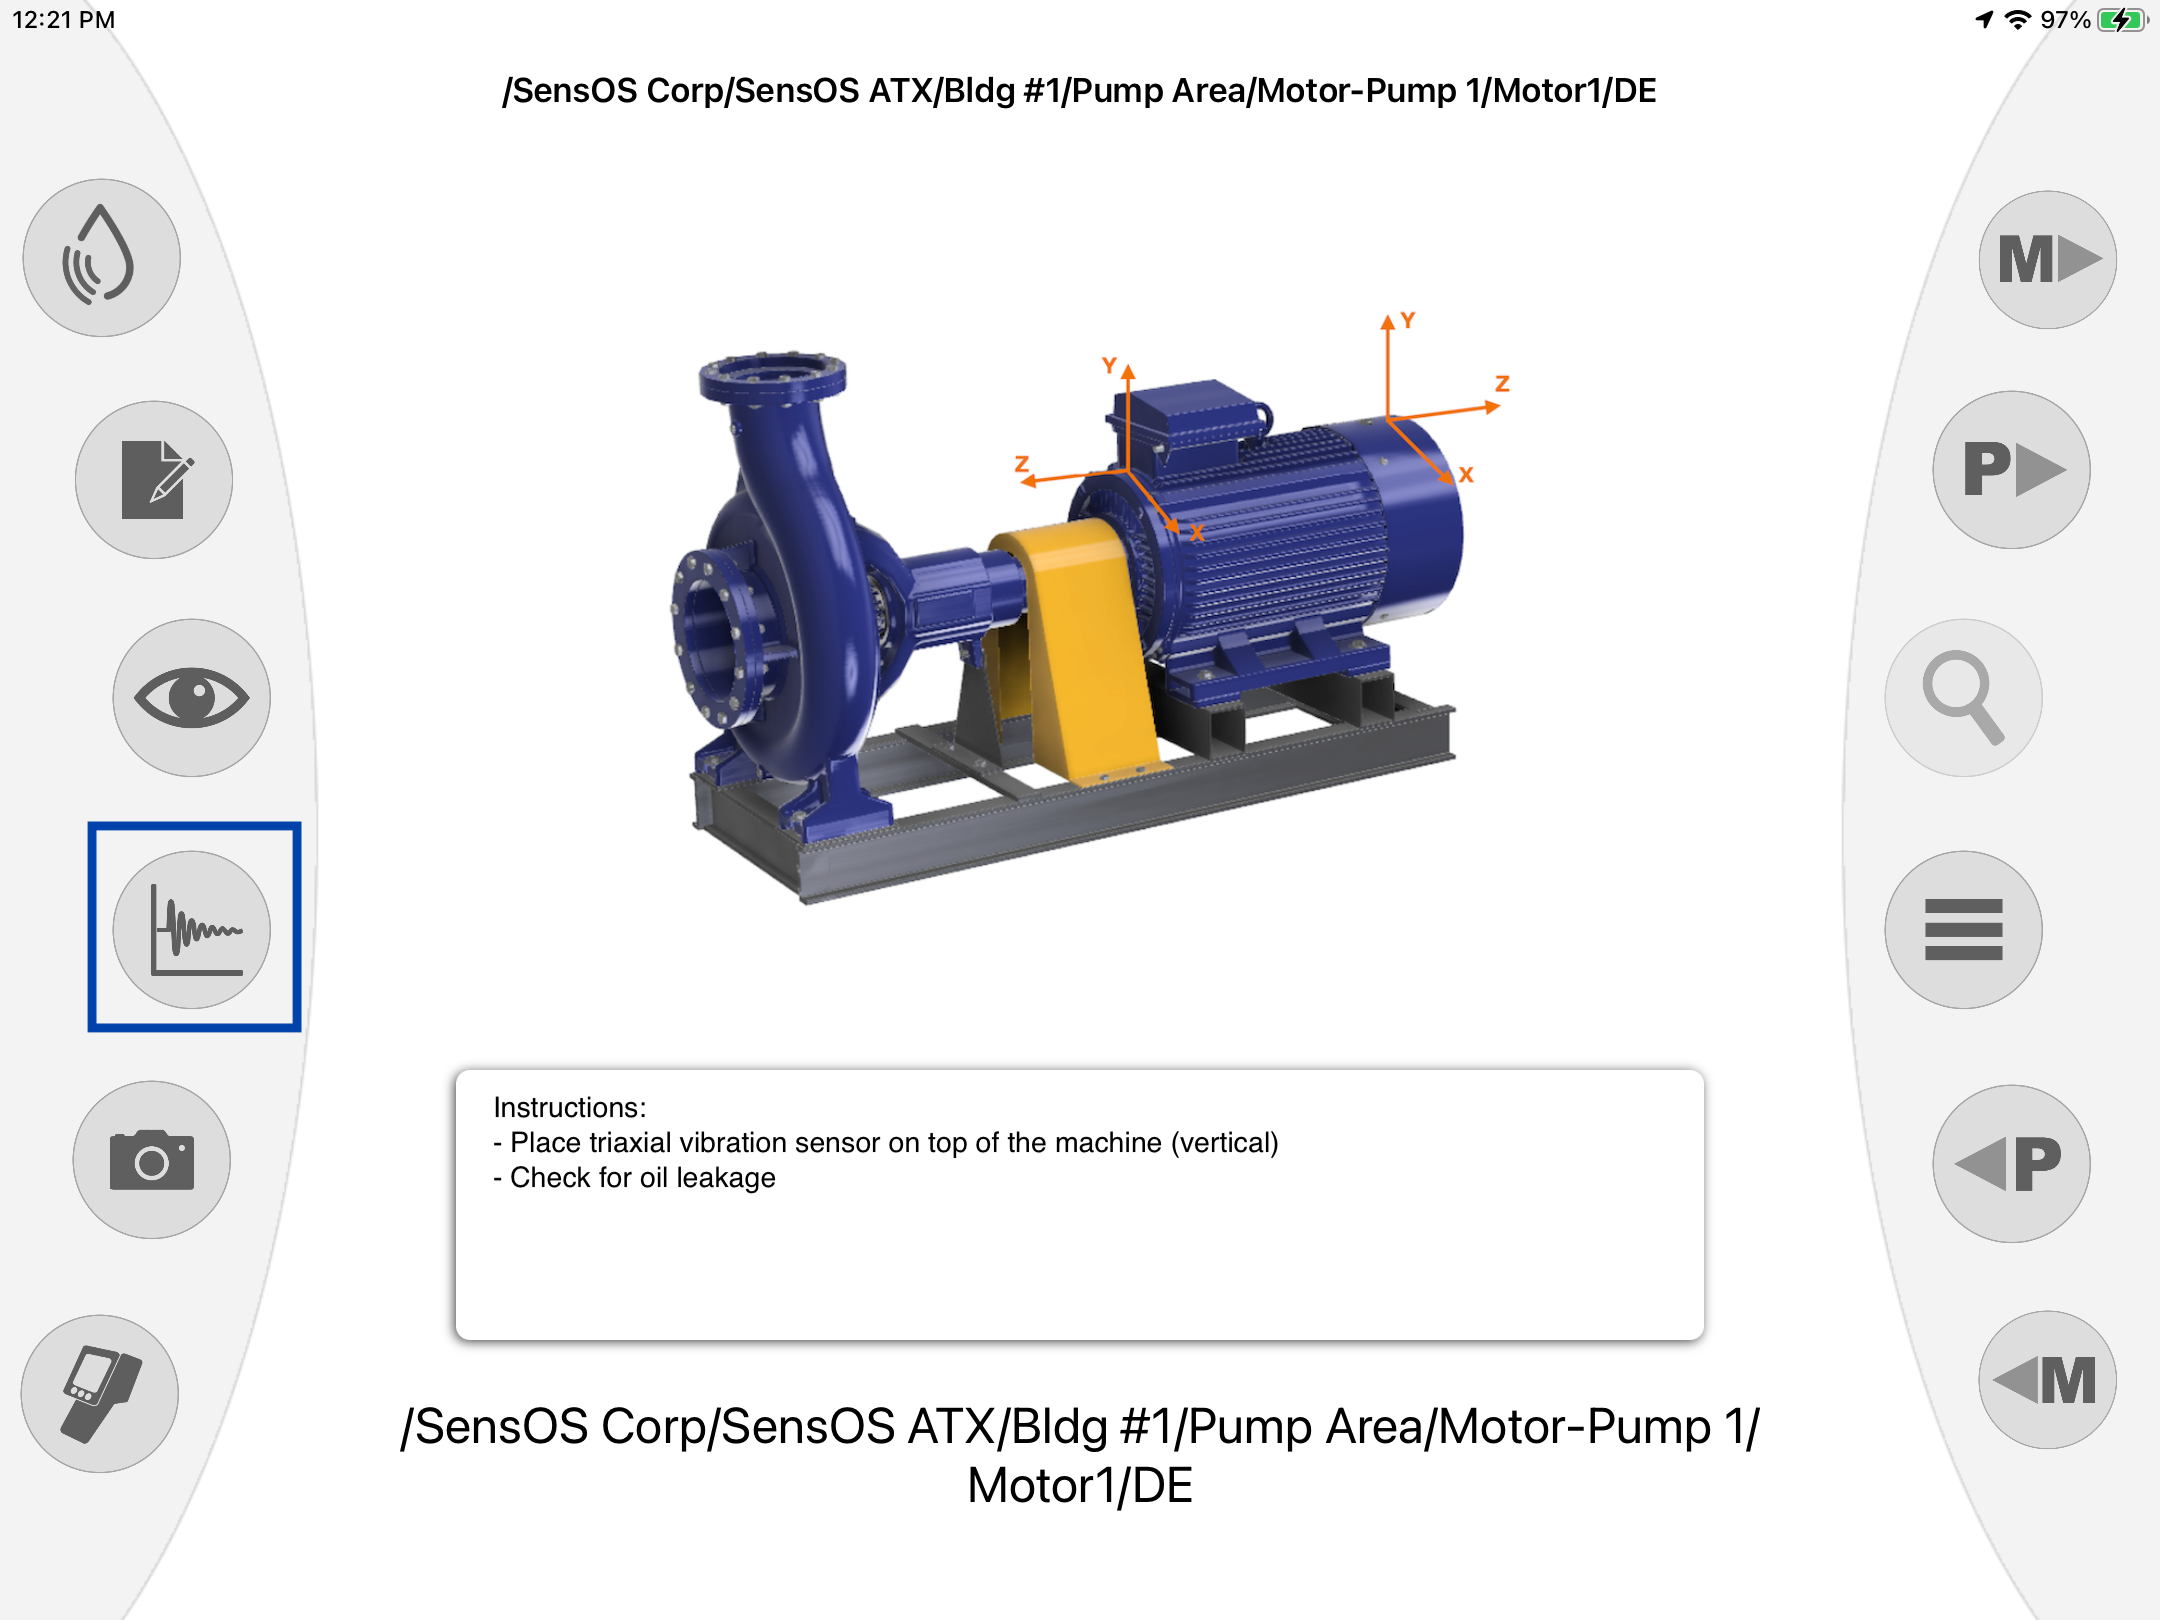
- Pressing 'Collect Data' (Motor icon) button, will open the data collection user interface. The initial view will be a picture or diagram of the asset with instructions to the technician (the initial view can be changed to default to vibration, thermal image, etc in the main configuration, see Configuration item 2 for more details).
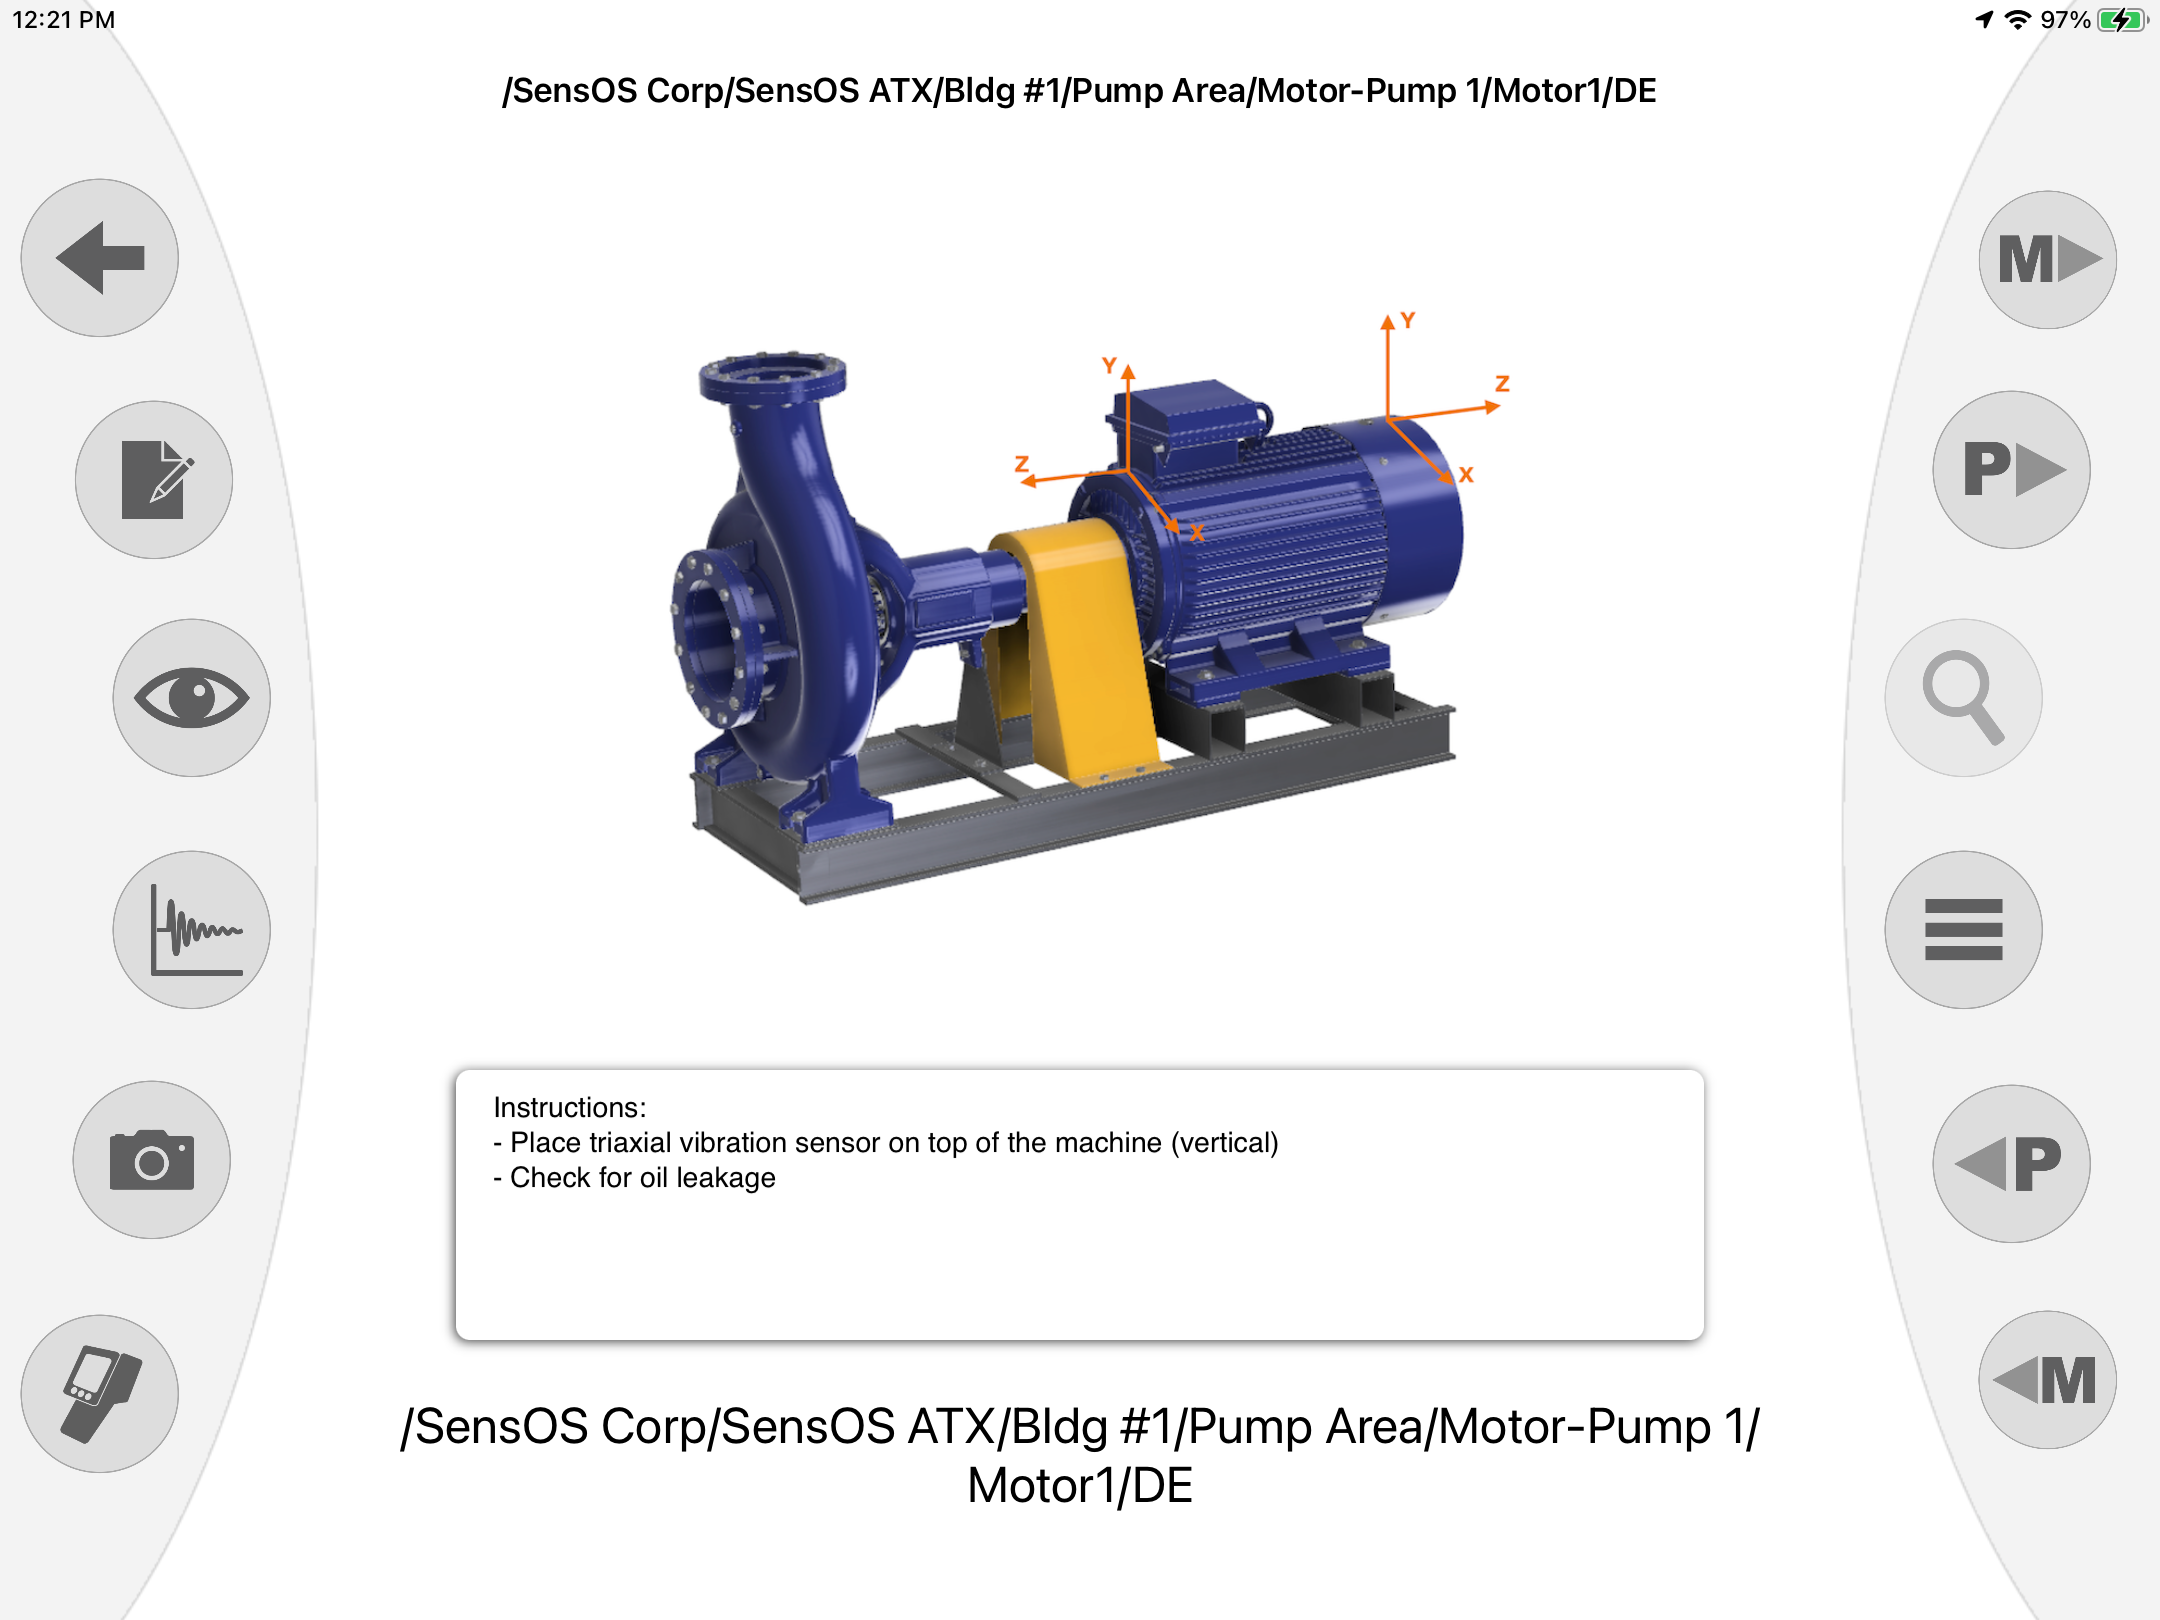
Navigating the Route
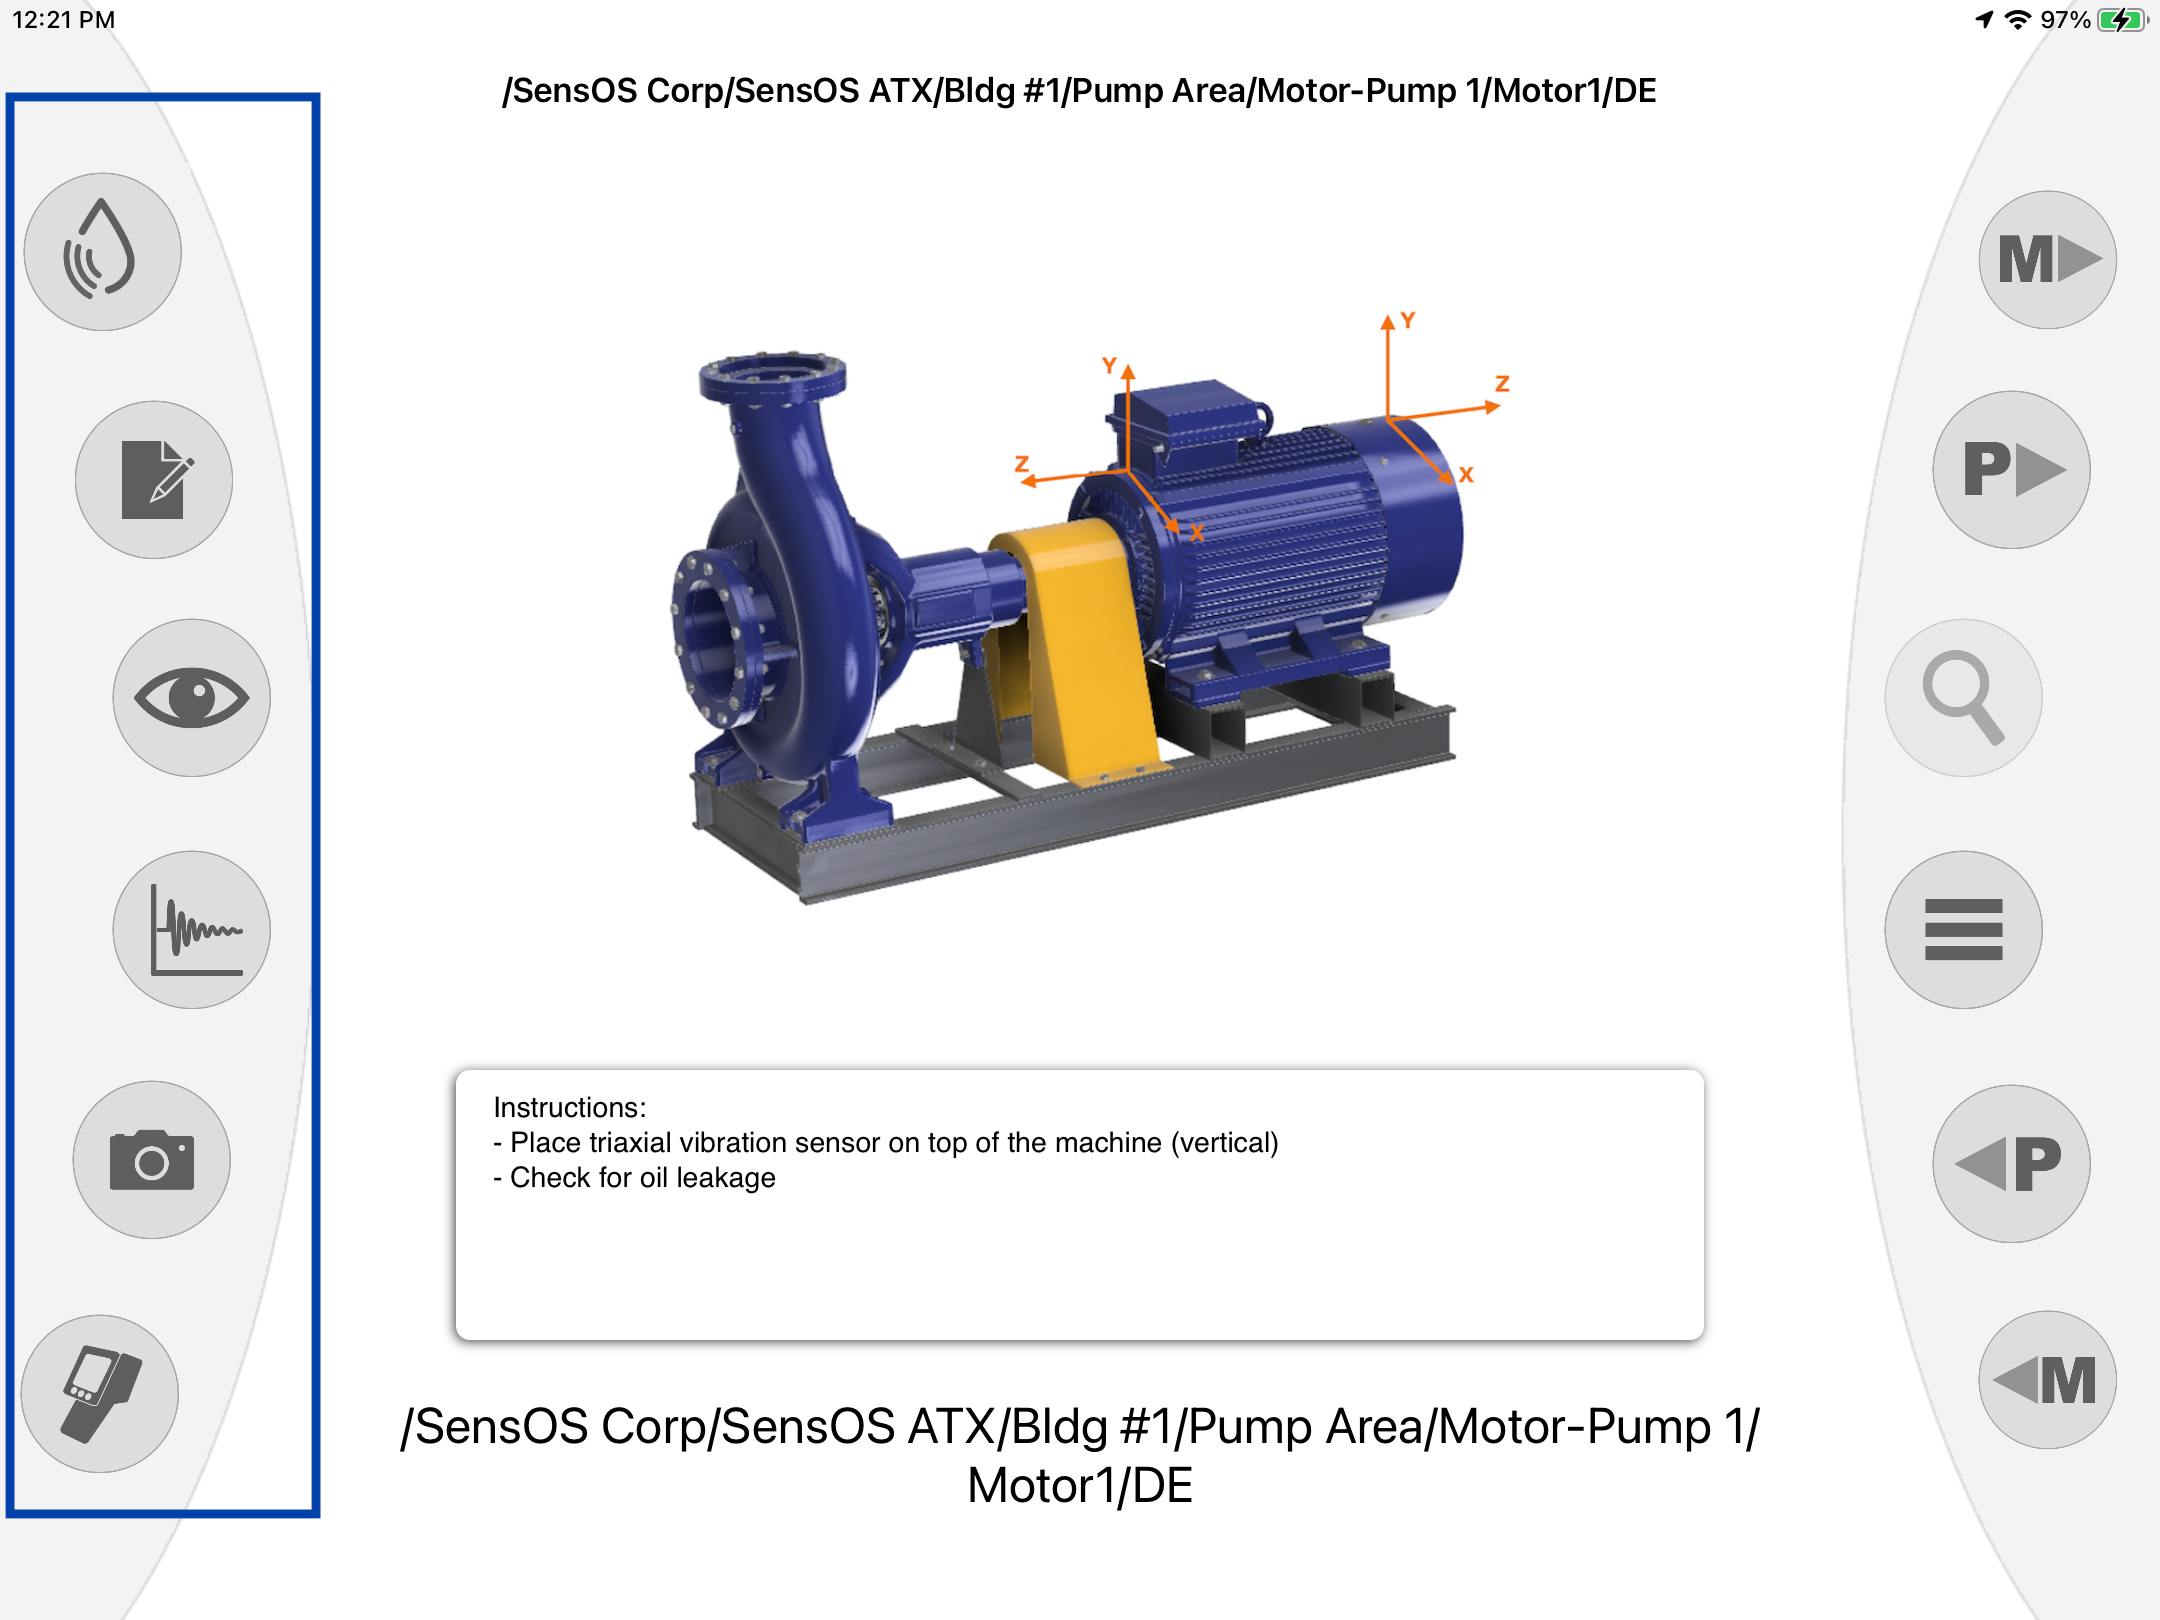
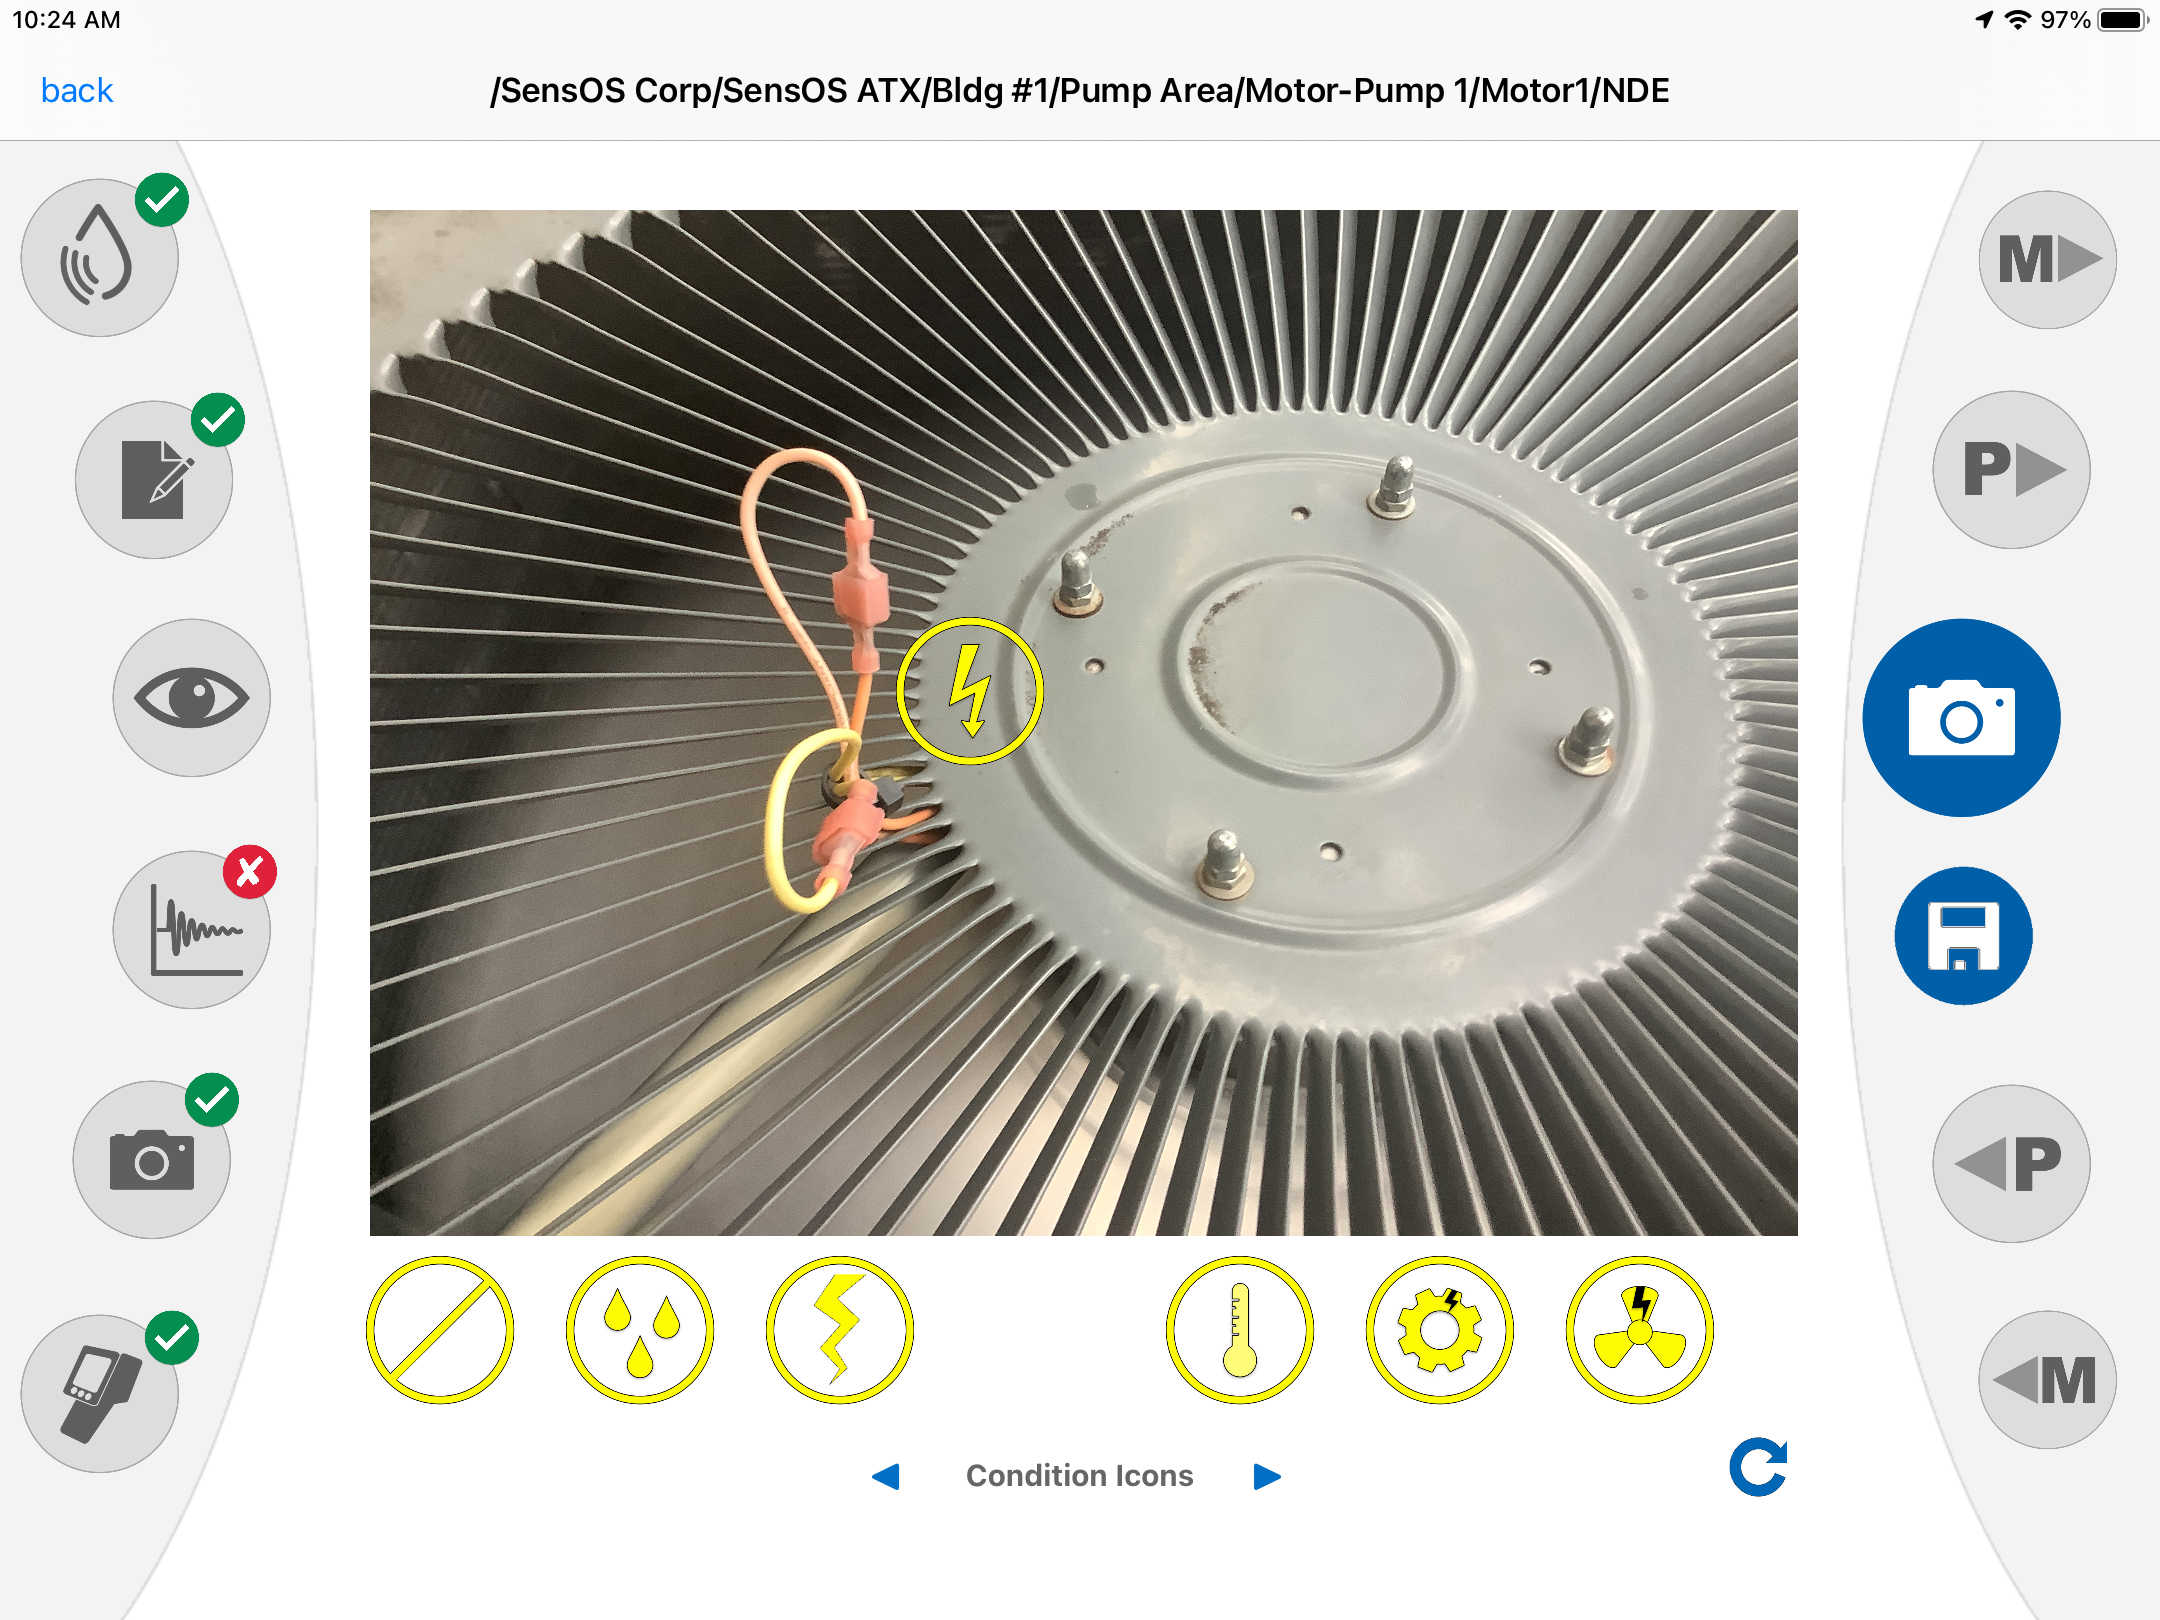
- The left Panel buttons will allow the user to select different CBM methods (from top to bottom: Ultrasonic, Annotations, Asset Diagram, Vibration, Photo & Thermal Imaging.
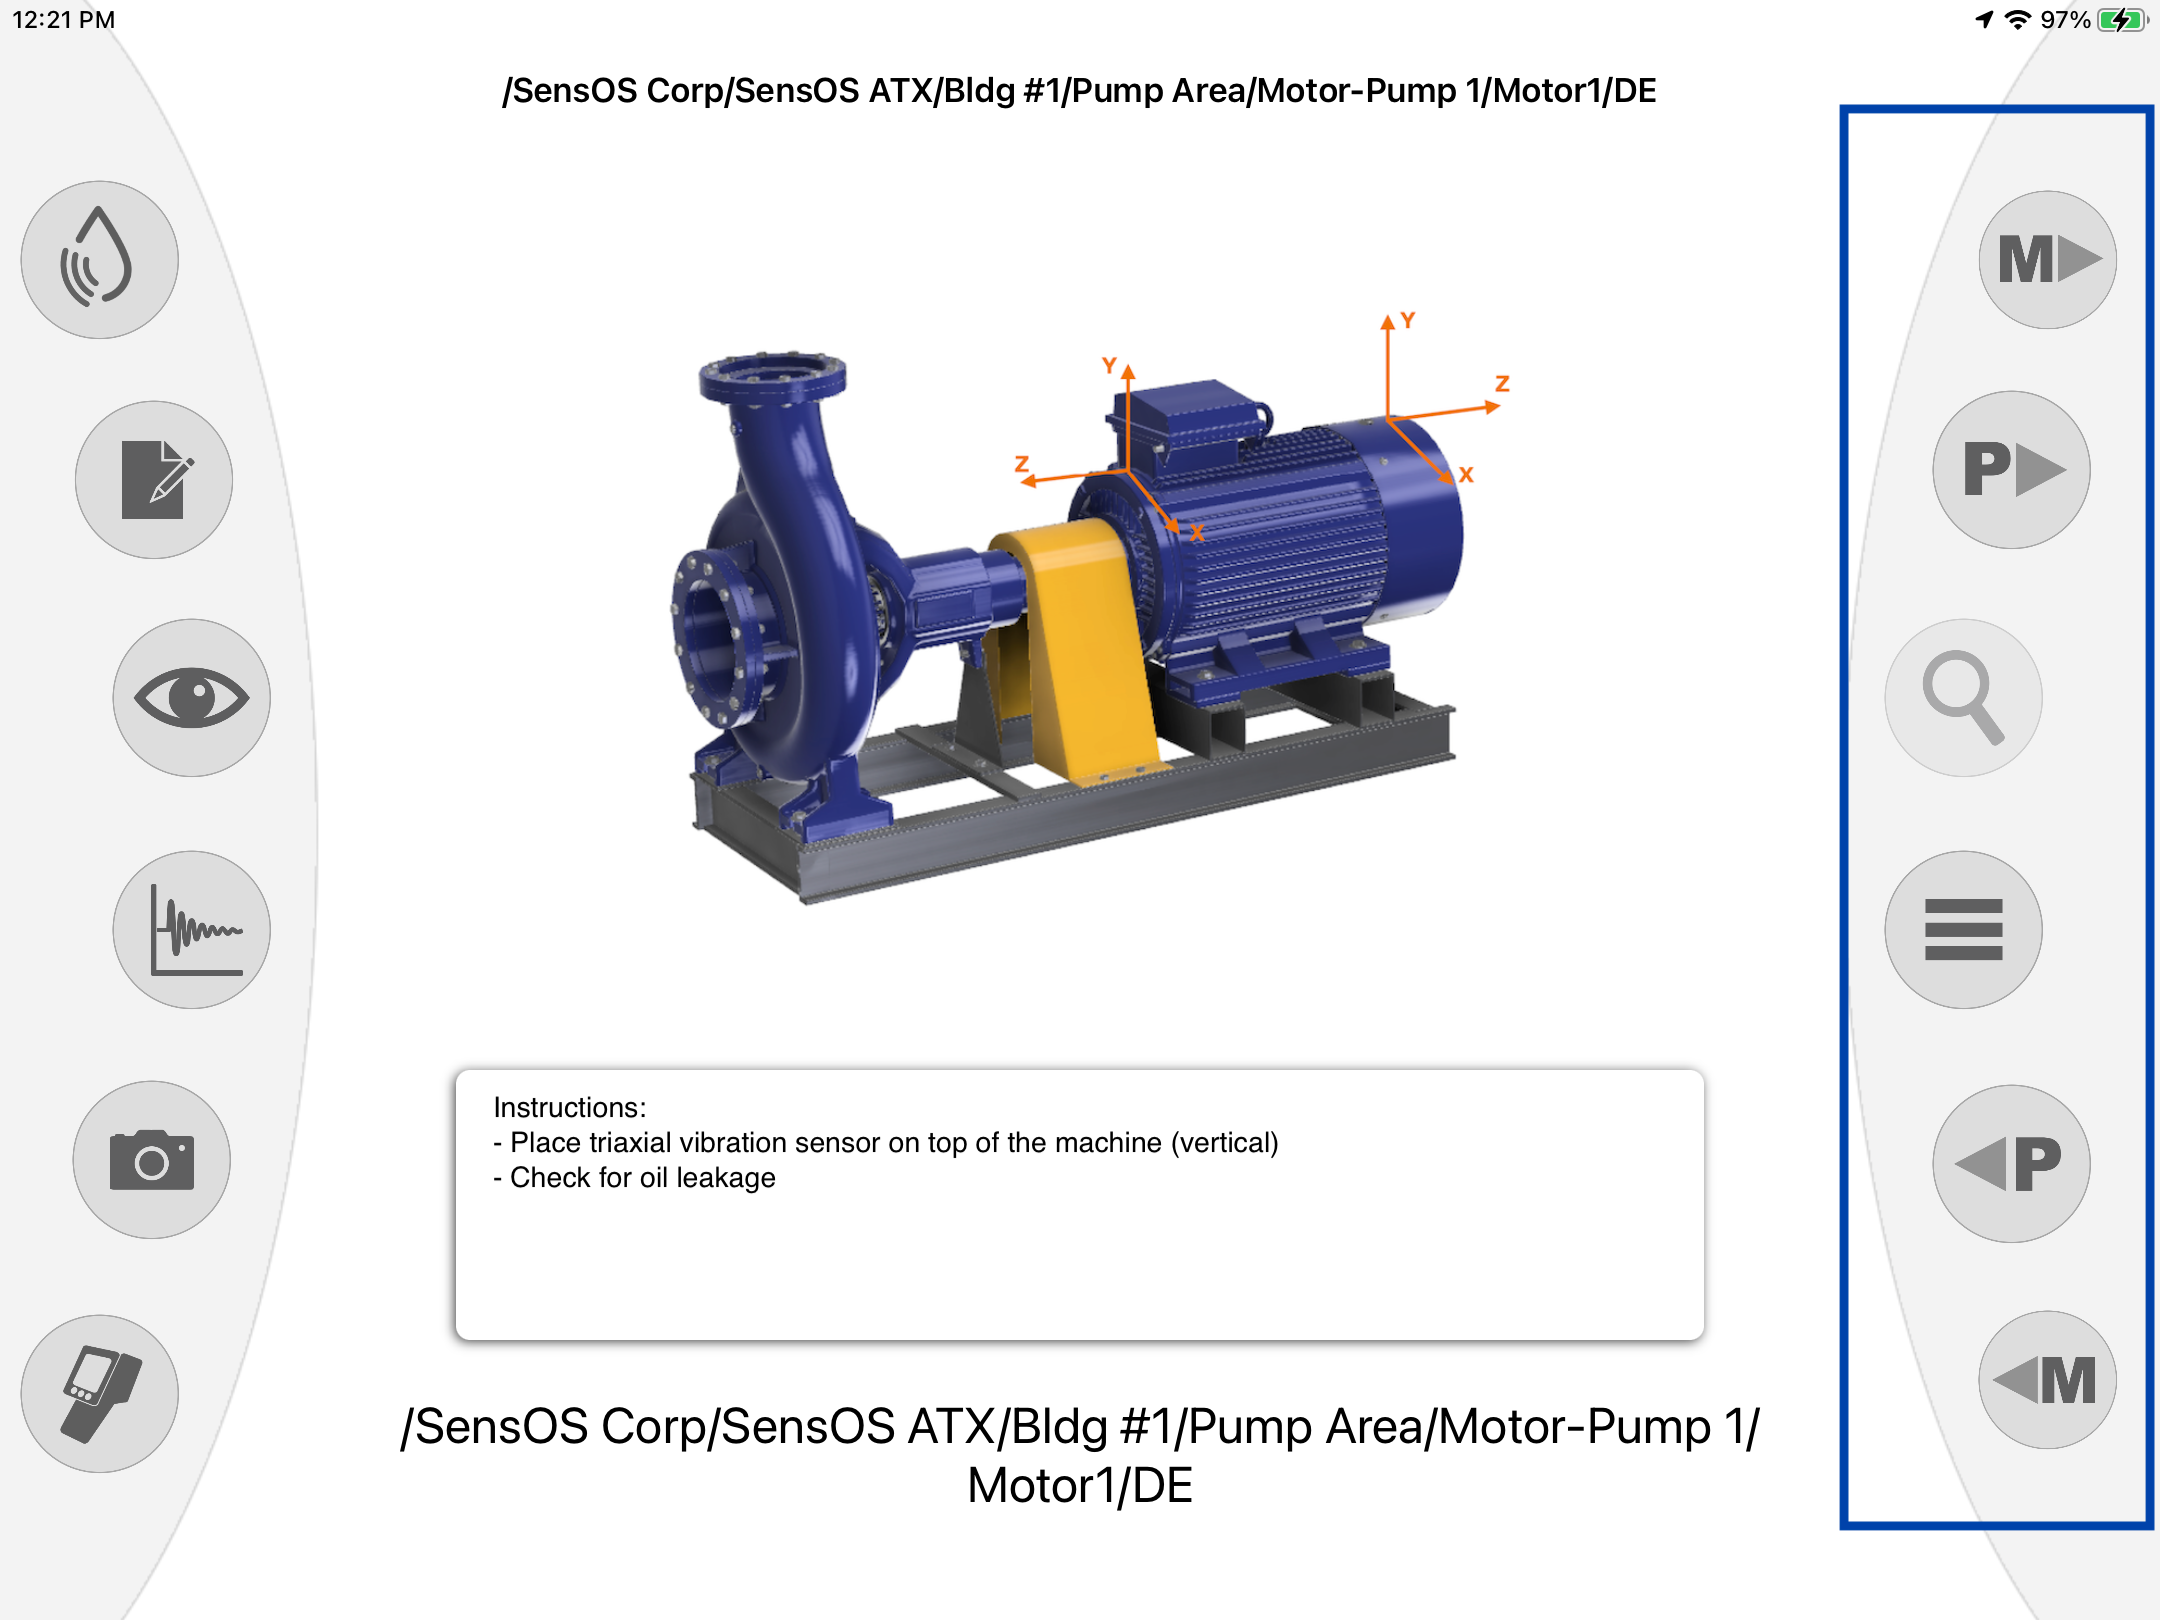
- The right panel will allow the following options: from top to bottom: 'M▶︎' move to next Machine, 'P▶︎' advance to next Route Point, 'Magnifier' view collected data, 'Hamburger Menu' opens a pop-up with the list of points (see item 3 below), '◀︎M' move to previous Machine, '◀︎P' go to previous Route Point
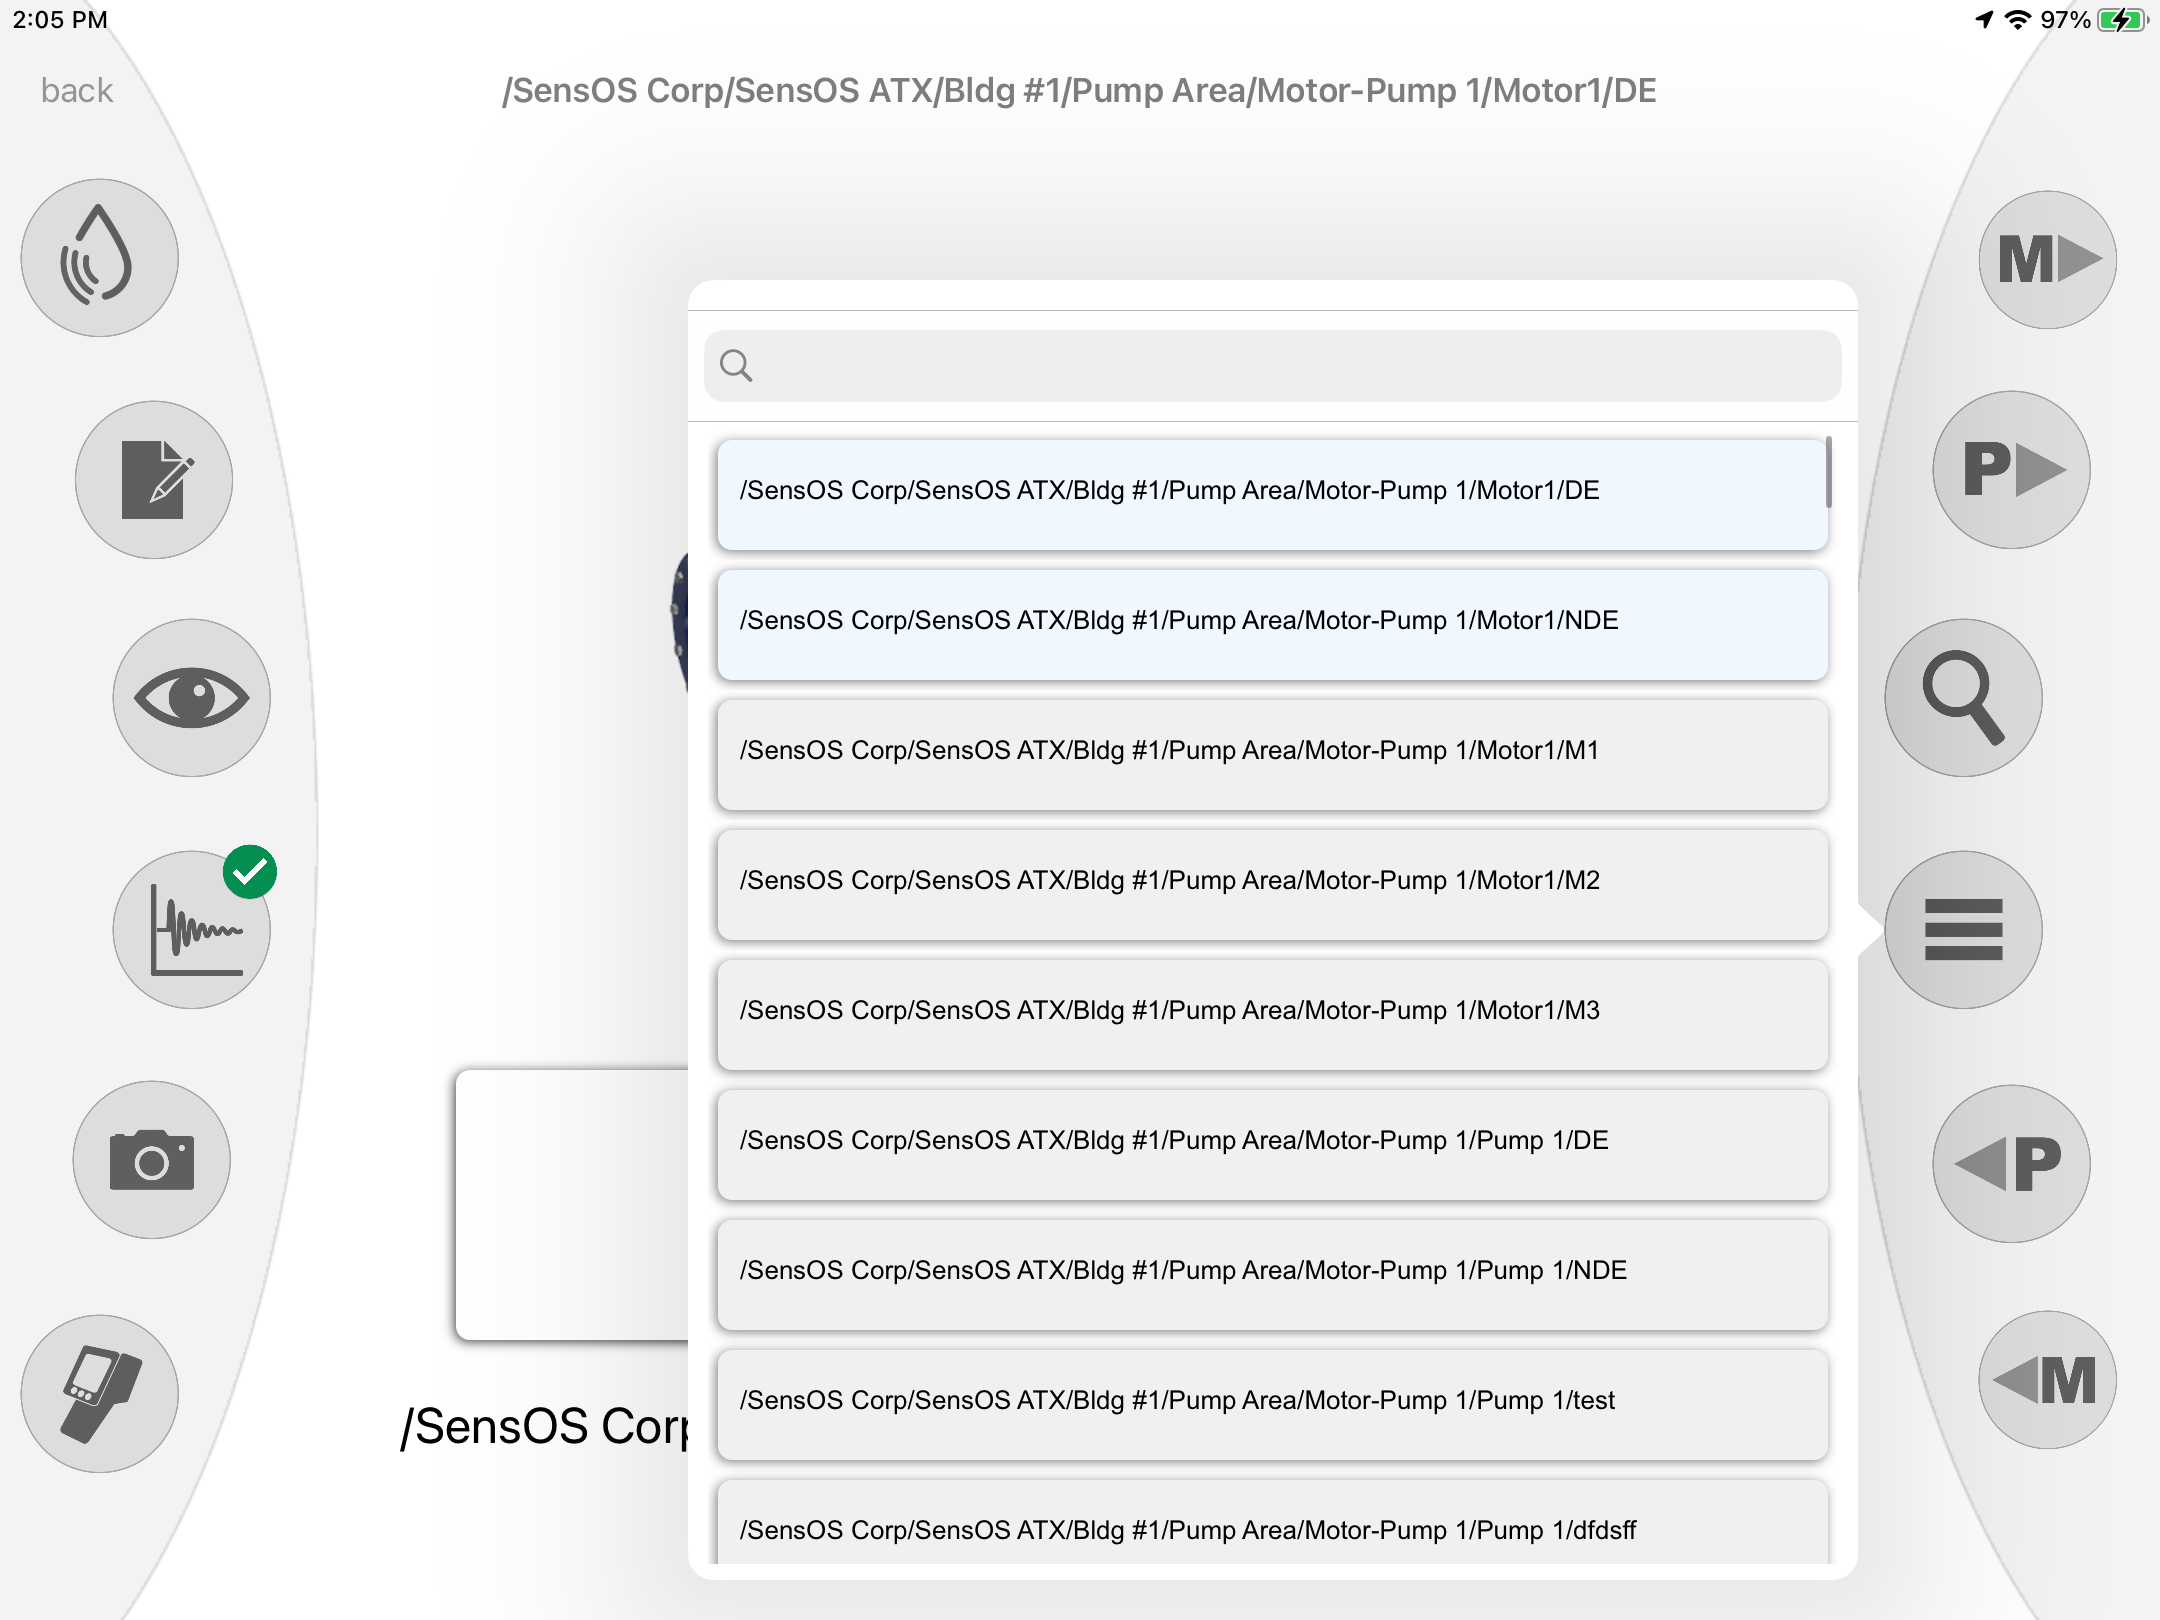
- Pressing the hamburger menu button on the right panel will open a pop-up with the list of all route and off-route points. The user can search or scroll to any point and jump directly to it. This is the only way to access off-route points.
- While navigating the left control panel buttons will show bubbles indicating if the reading was done '✔︎' or skipped '✖︎' for each of the CBM methods.
Collecting Vibration Readings
- To collect vibration data, the user will need to select a default vibration sensor first, see Configuration item 1 & 3 for more details. Then press the Vibration button to show the vibration data collection view.
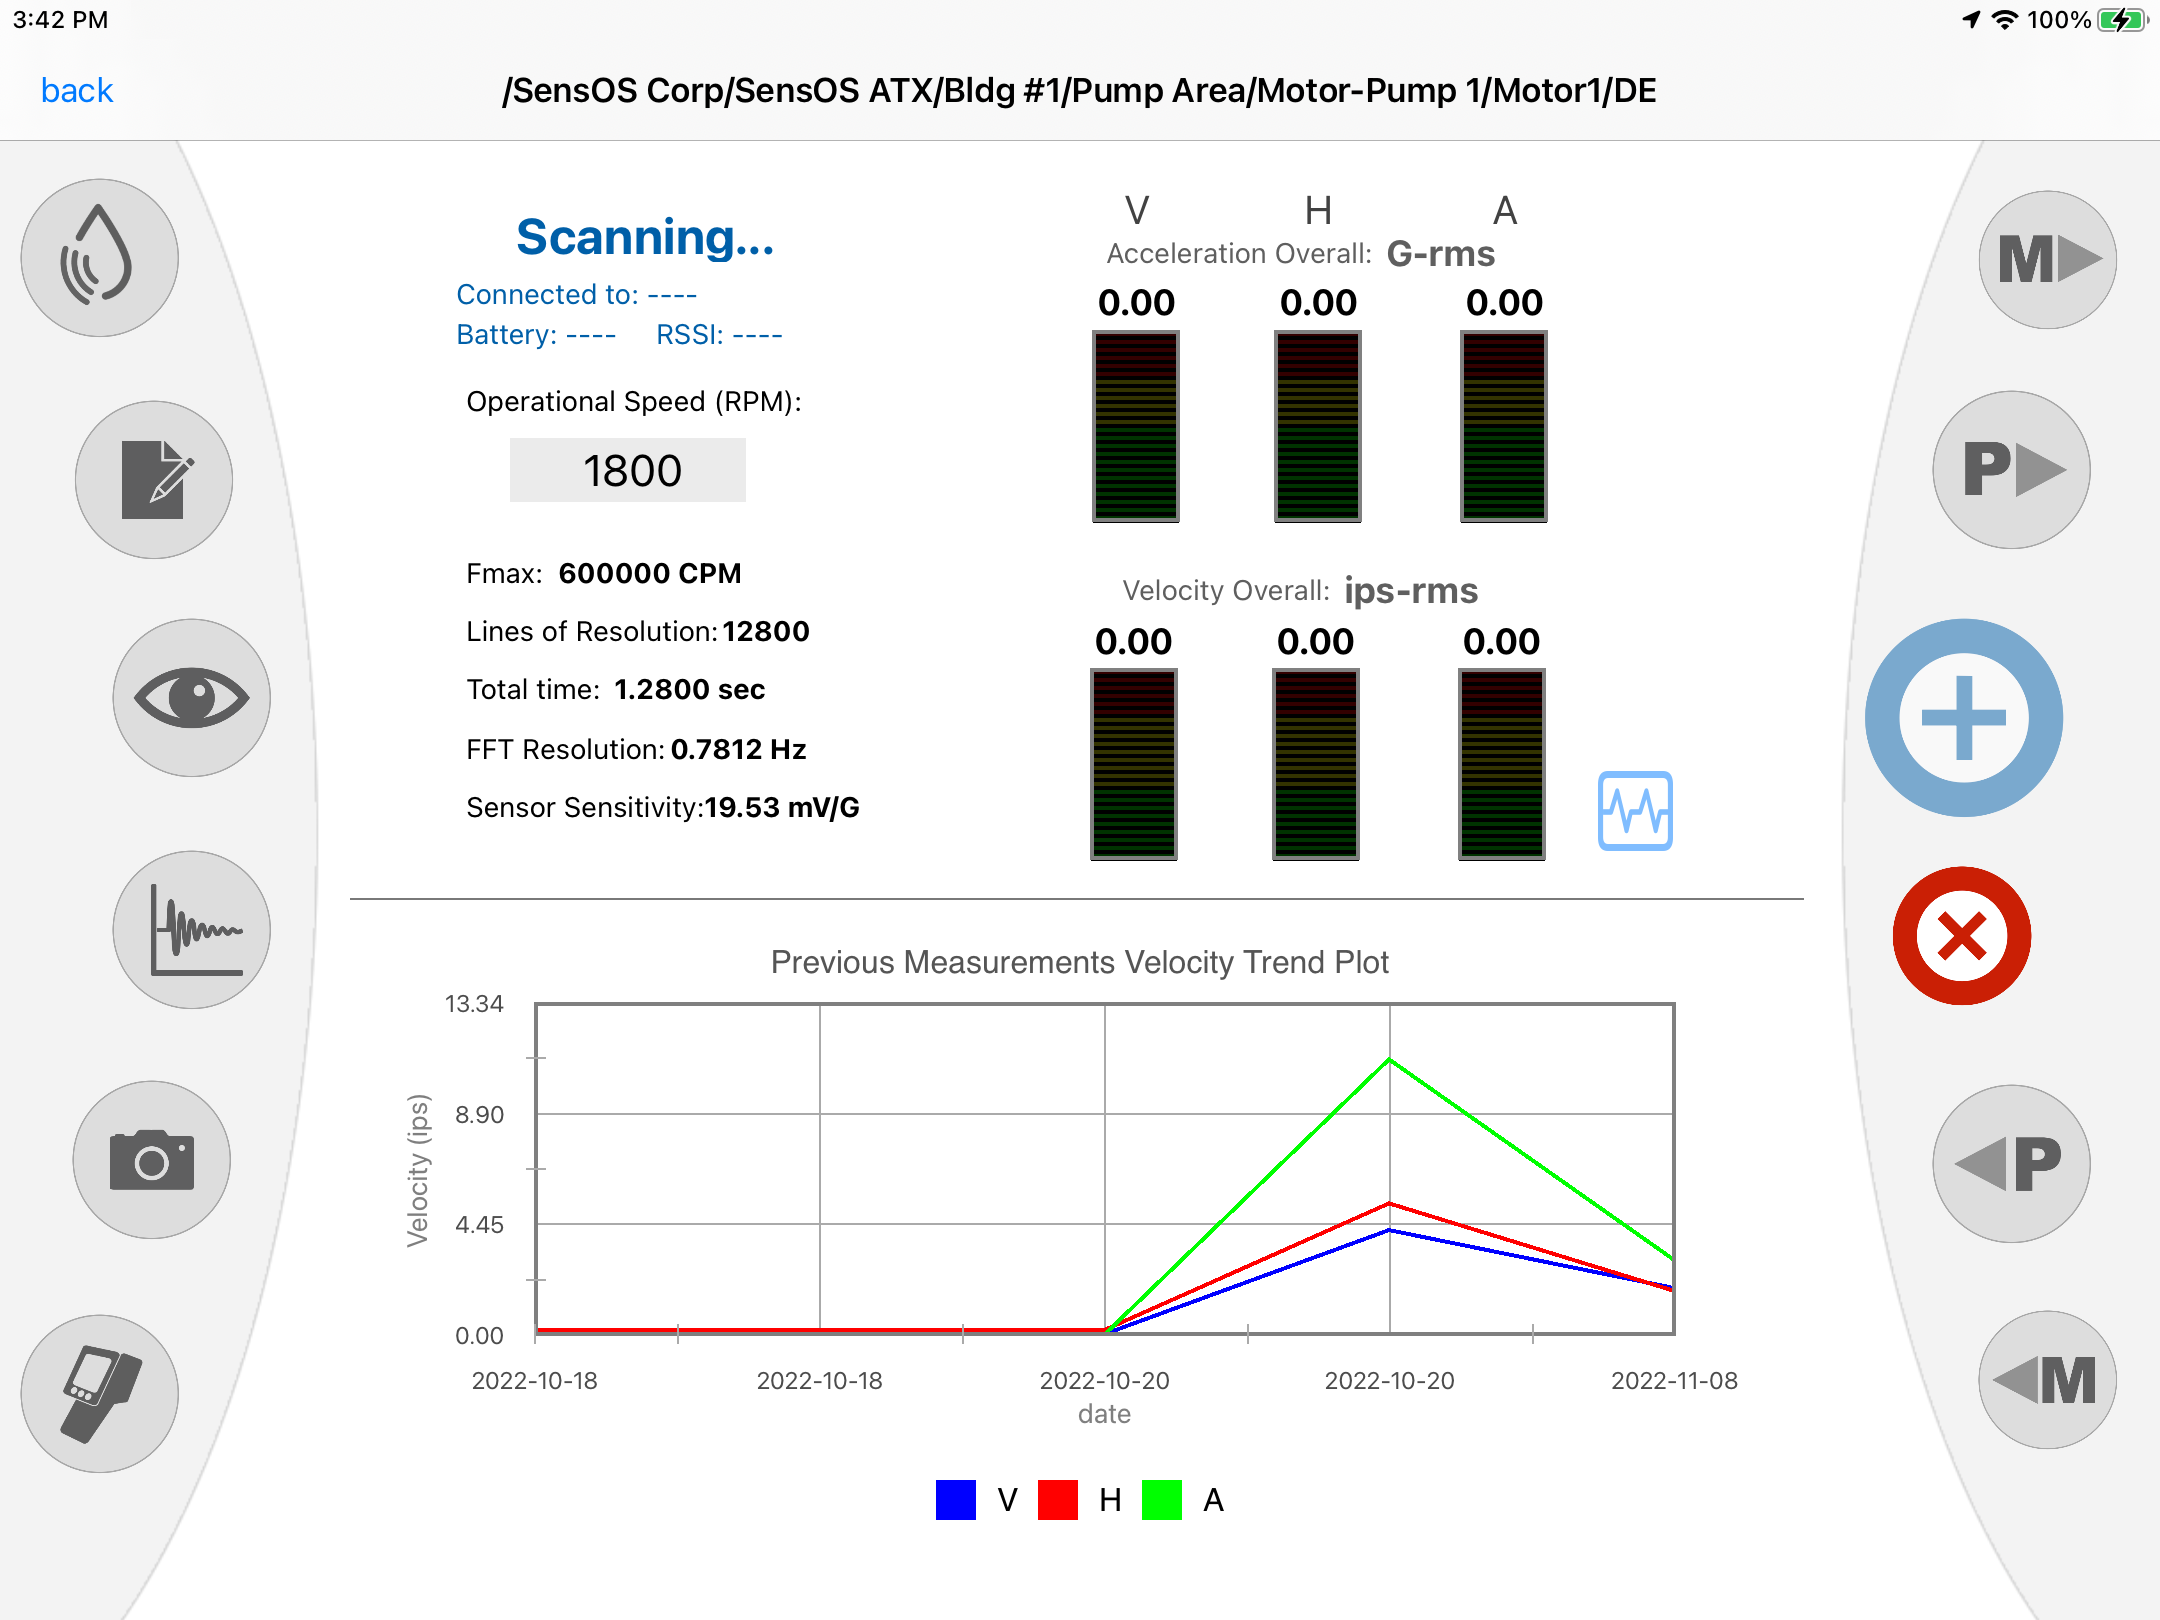
- Navigate to the desired point and turn on the wireless sensor (if needed), the app will Scan for the available wireless sensors, as shown below
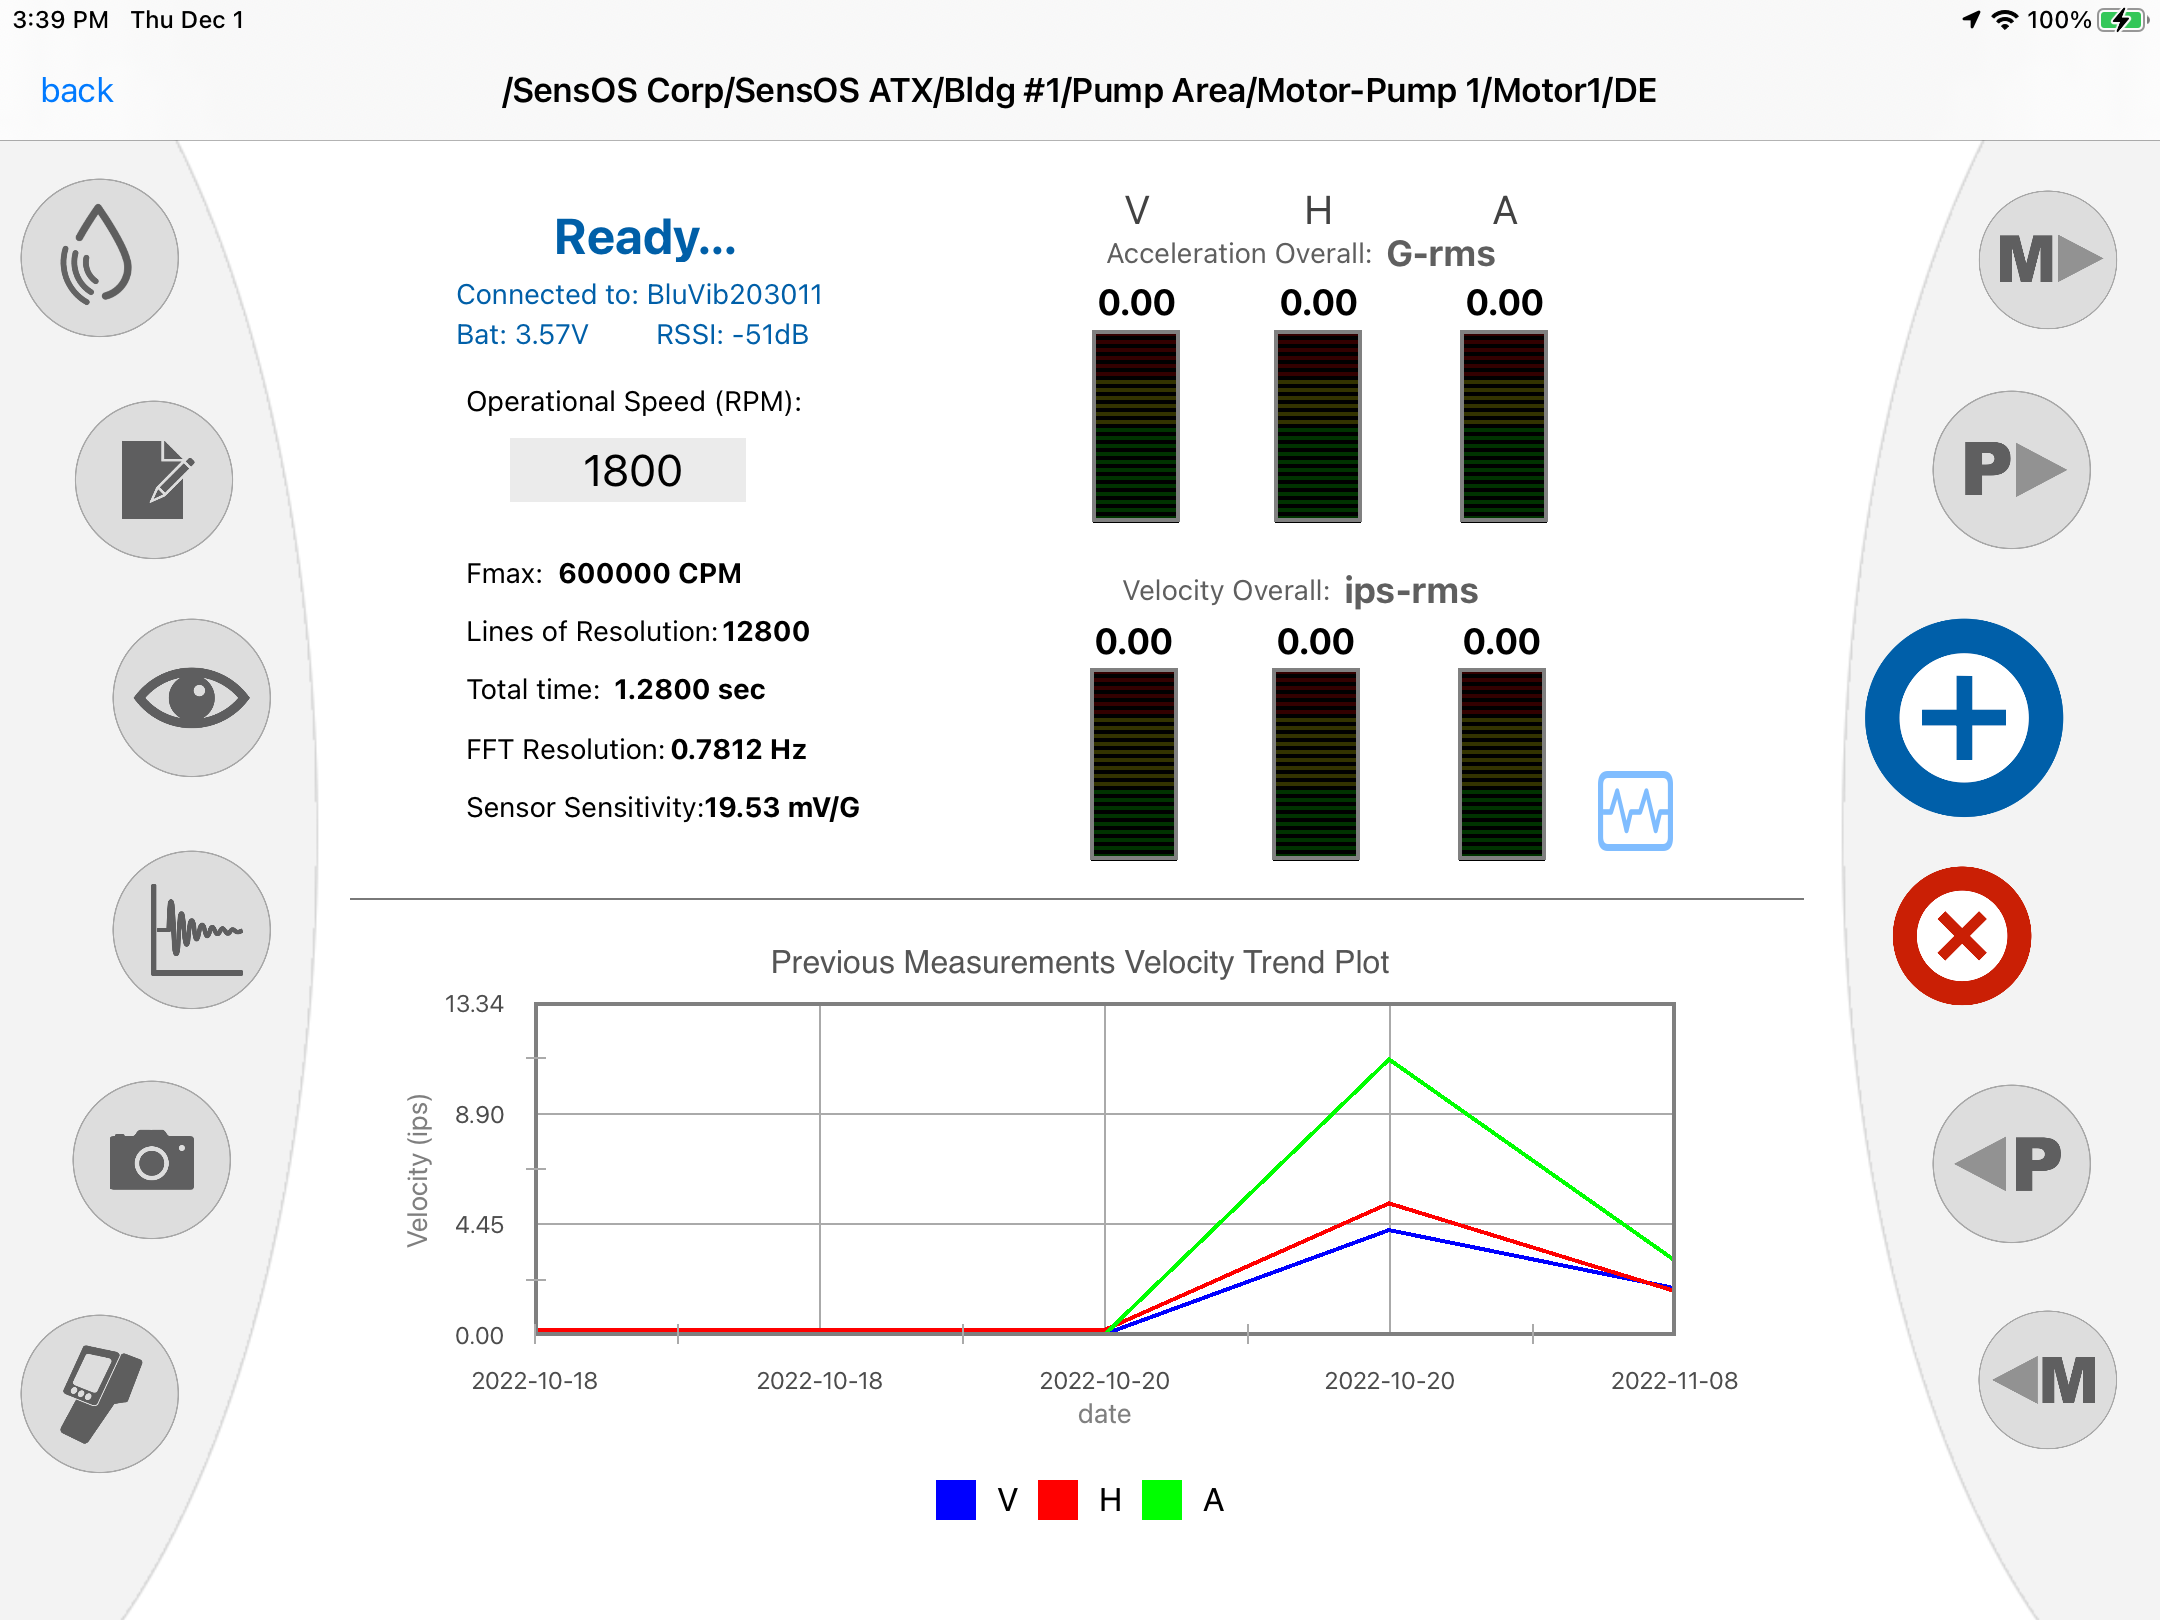
- Once the sensor connects, it will display that its status is Ready. The RPM and sampling settings for the readings are part of the point configuration in the MS-Cloud platform, and will show below the Sensor's status. The Trend below show the last 5 overall values of the vibration (Velocity or Acceleration, this can be set in the Configuration View)
- The user can change the RPM value by pressing over the RPM field, the calculator will allow to enter the actual operational RPM value. This value will be reported to the MS-Cloud platform but will not change the machine's default RPM.
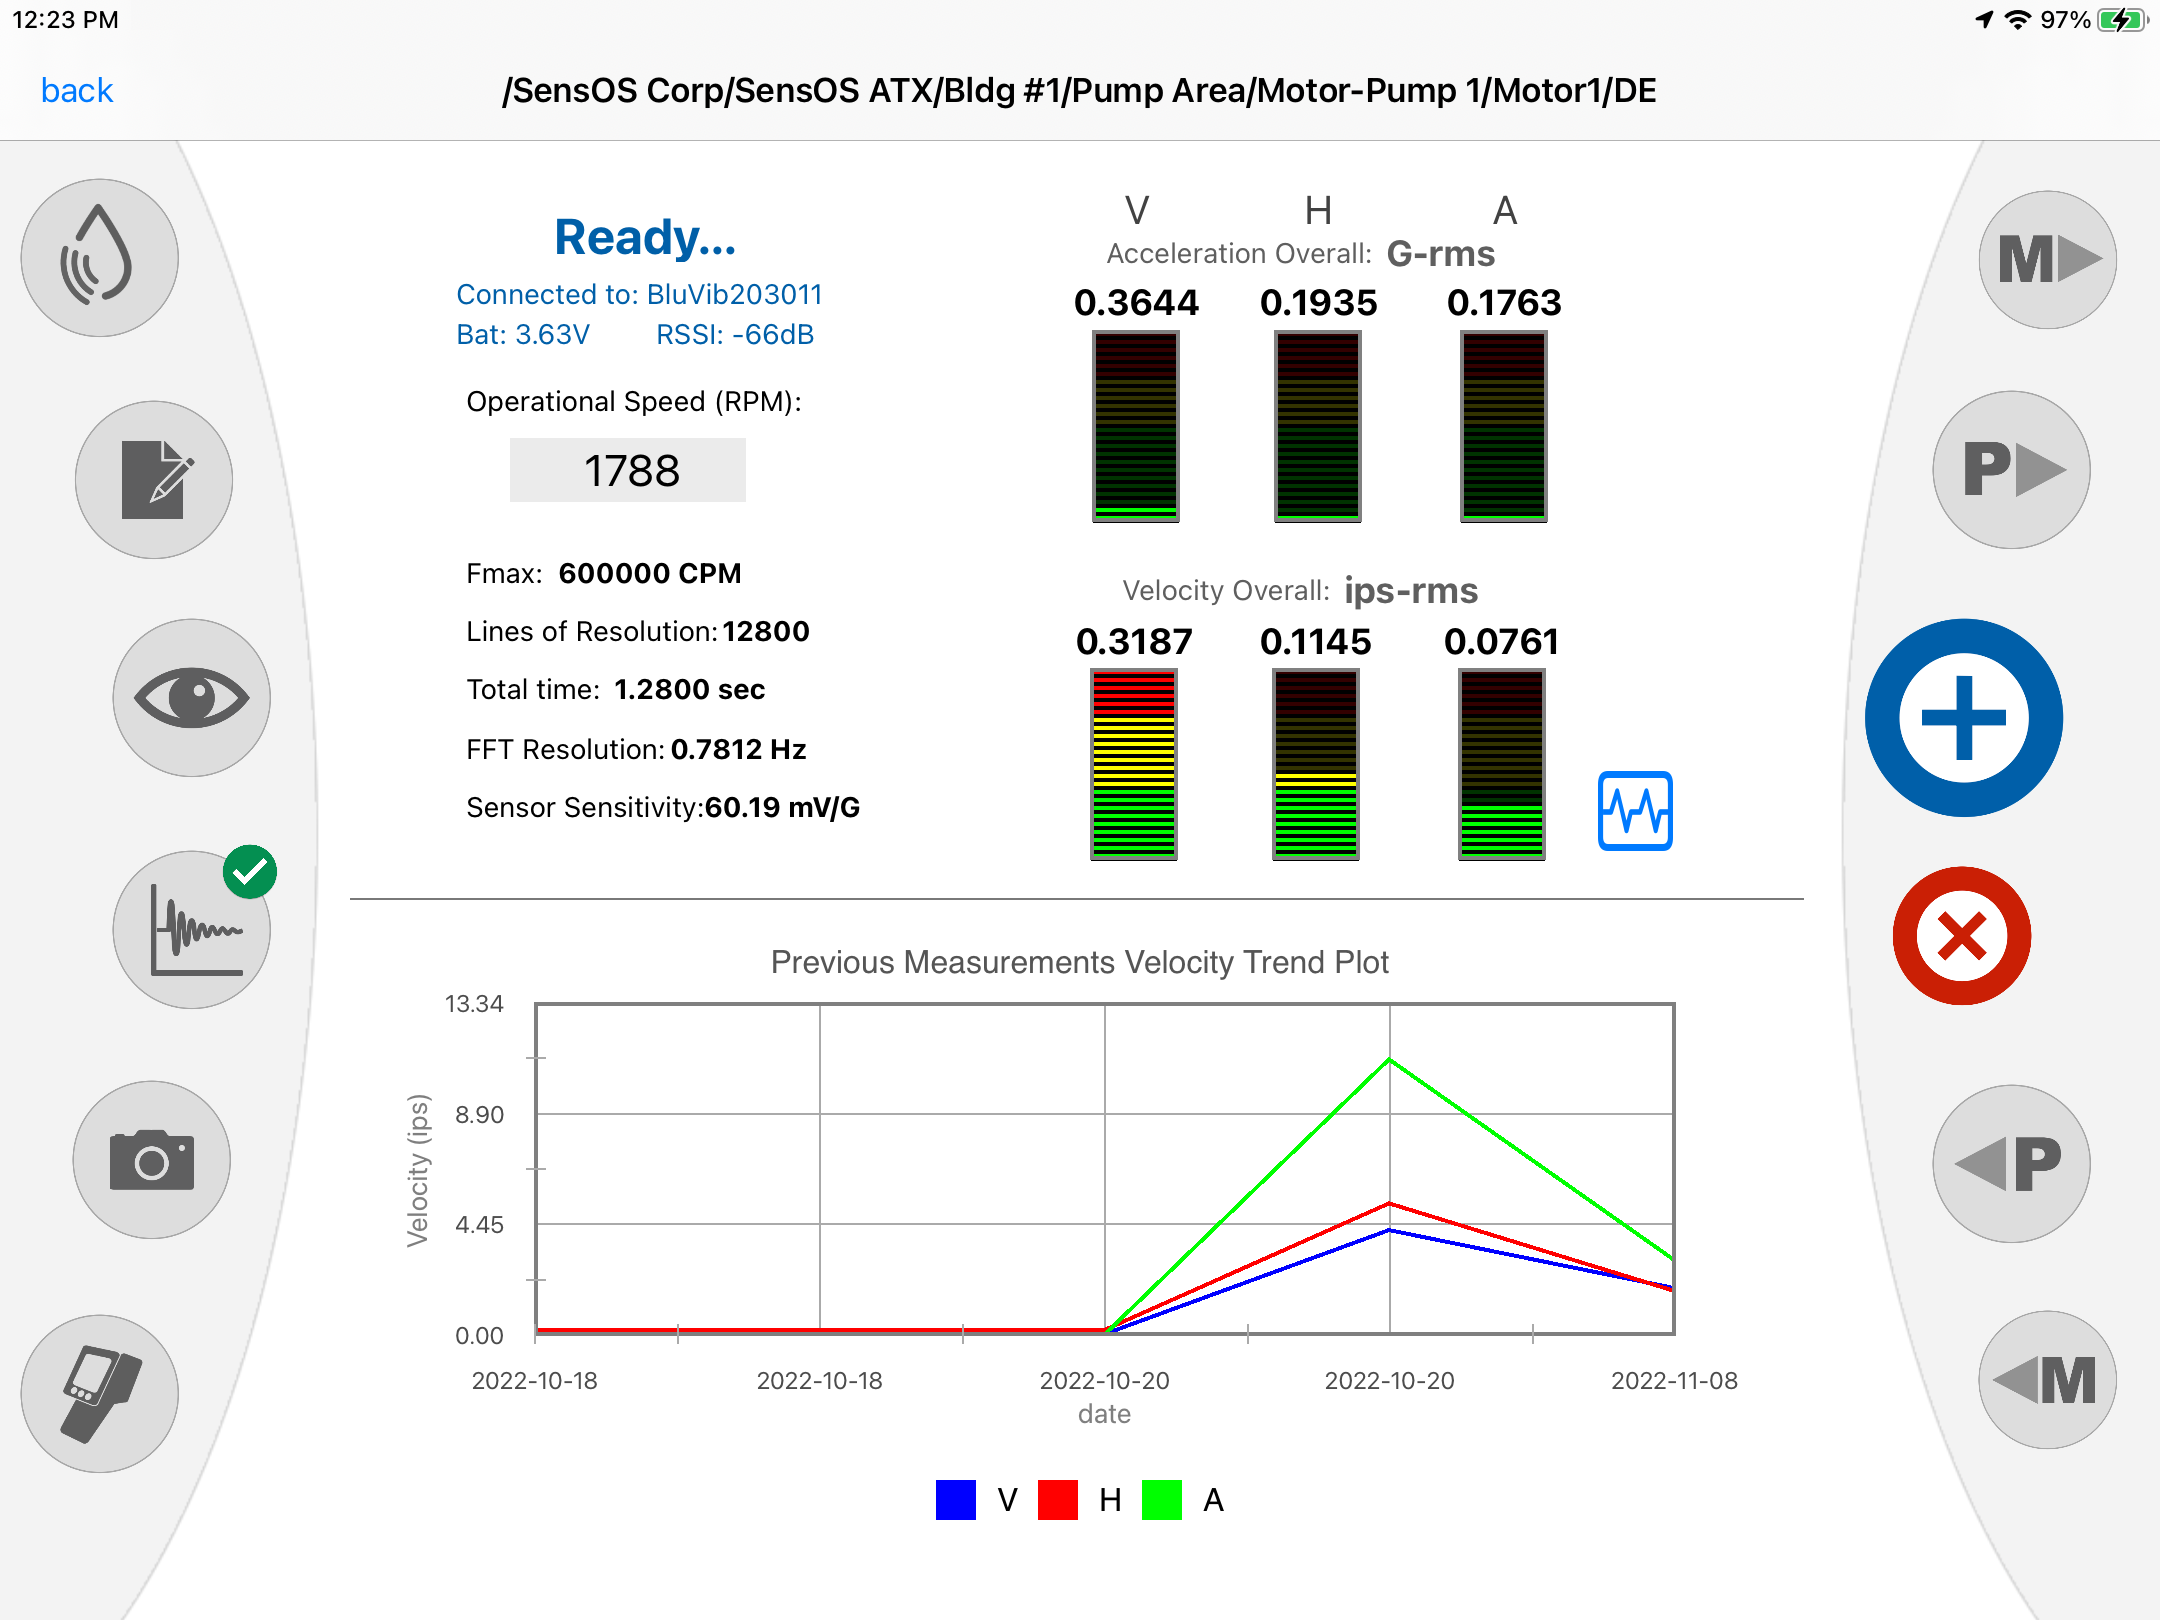
- Place the Accelerometer on the machine in the selected point and press the "➕" button on the Right Pannel to collect the vibration data. Once Data is collected it will display the overall values of the acceleration and velocity for the 3-Axes H-V-A.
- The user can check the time-waveform and spectrum of the collected data by pressing the "Vibration View" button located besides the vibration meters, see Analyzing Vibration for more details, or can navigate to the next point to be measured.

Analyzing Vibration
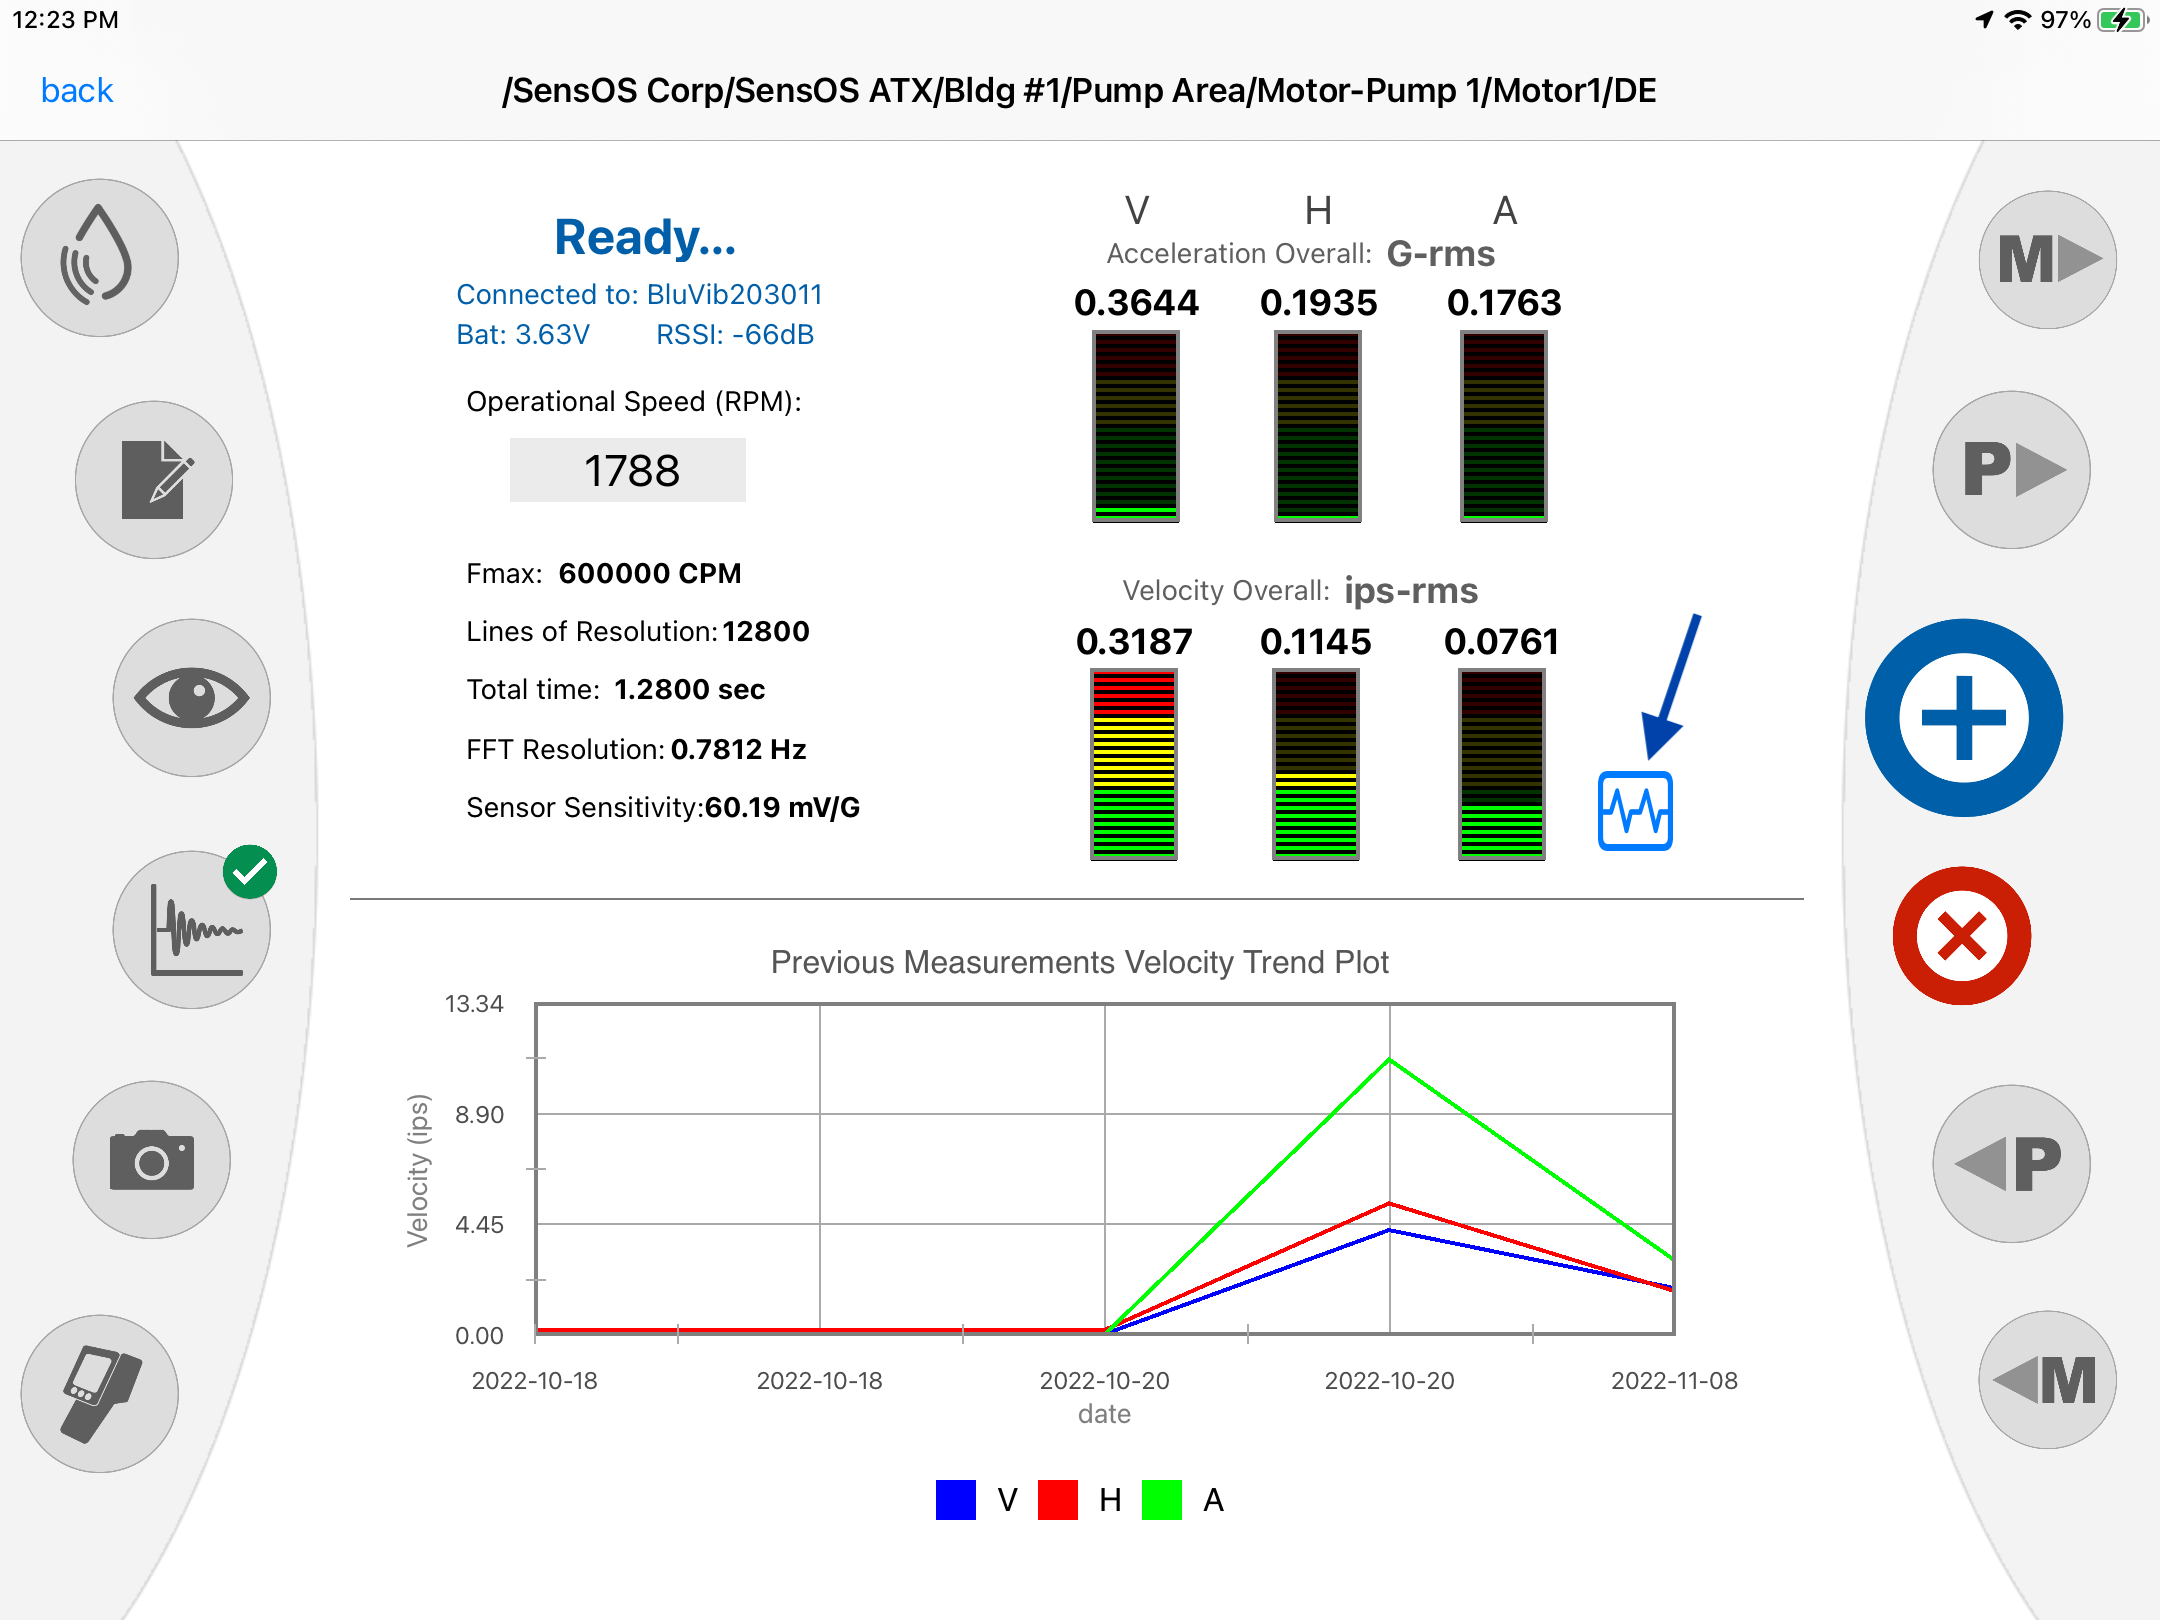
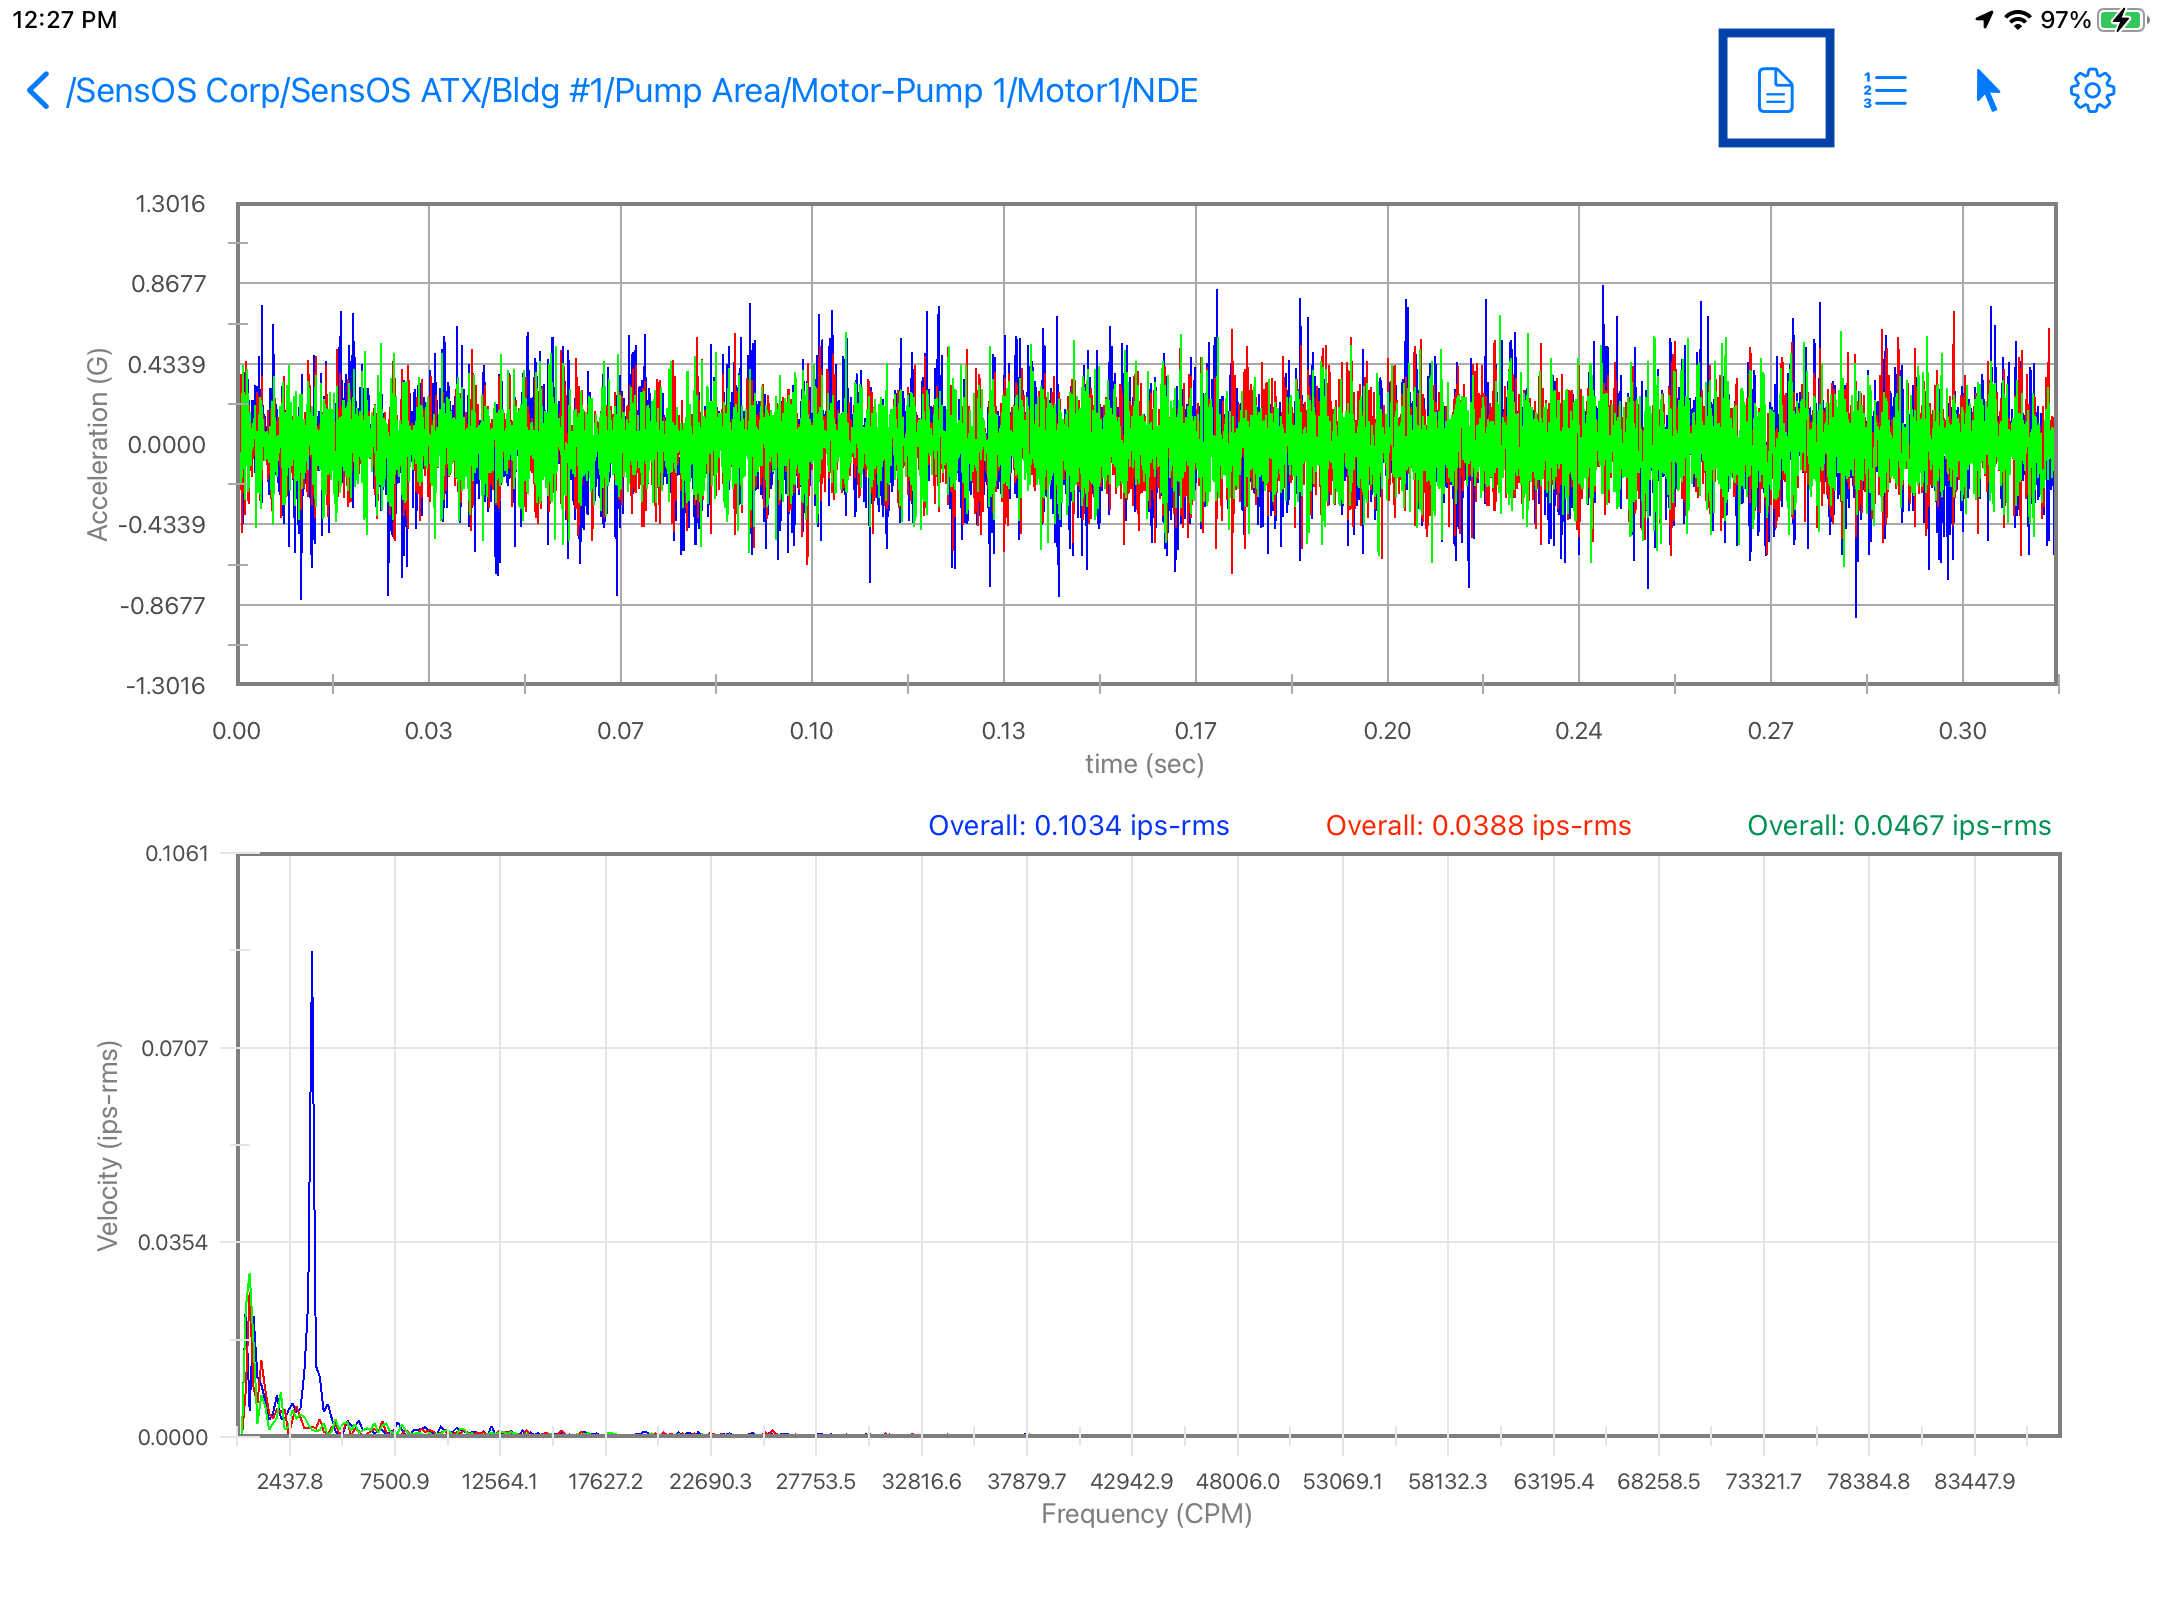
- Press the vibration view button (indicated below with an arrow) to open the vibration analysis view.
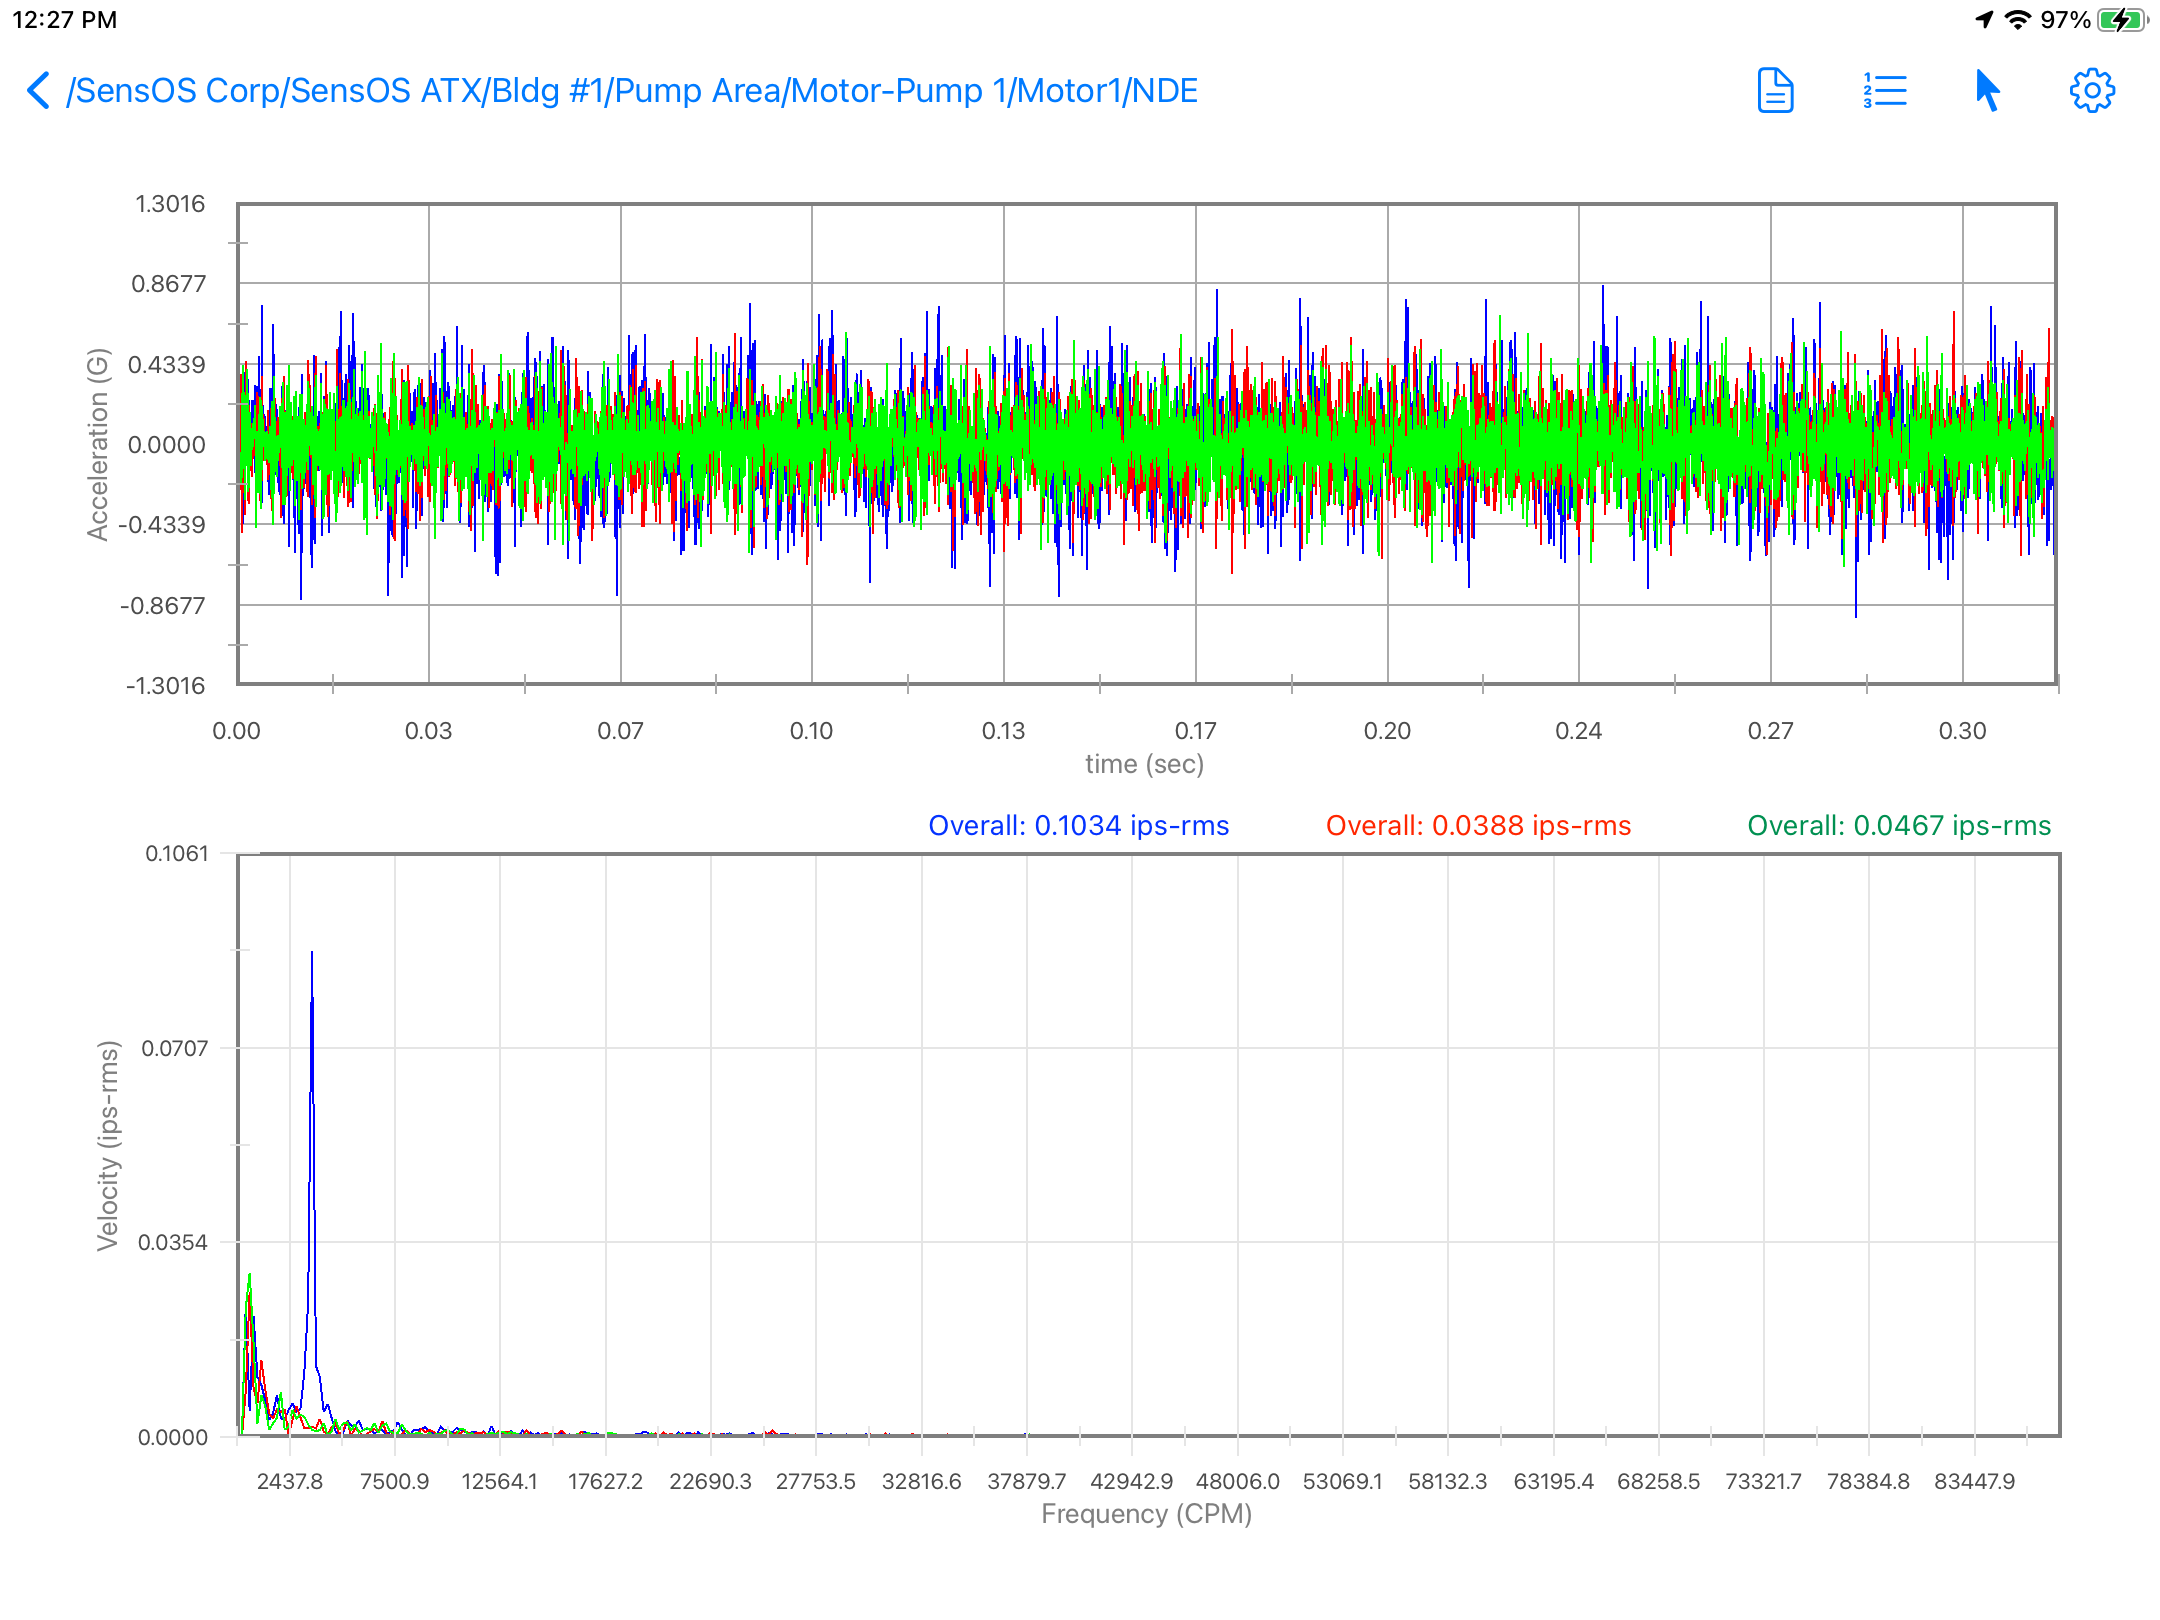
- The vibration analysis view will appear, showing the collected data in the time-domain and frequenct-domain. To zoom the plots use both fingers to pinch in and out, to pan use one finger and swipe left or right.
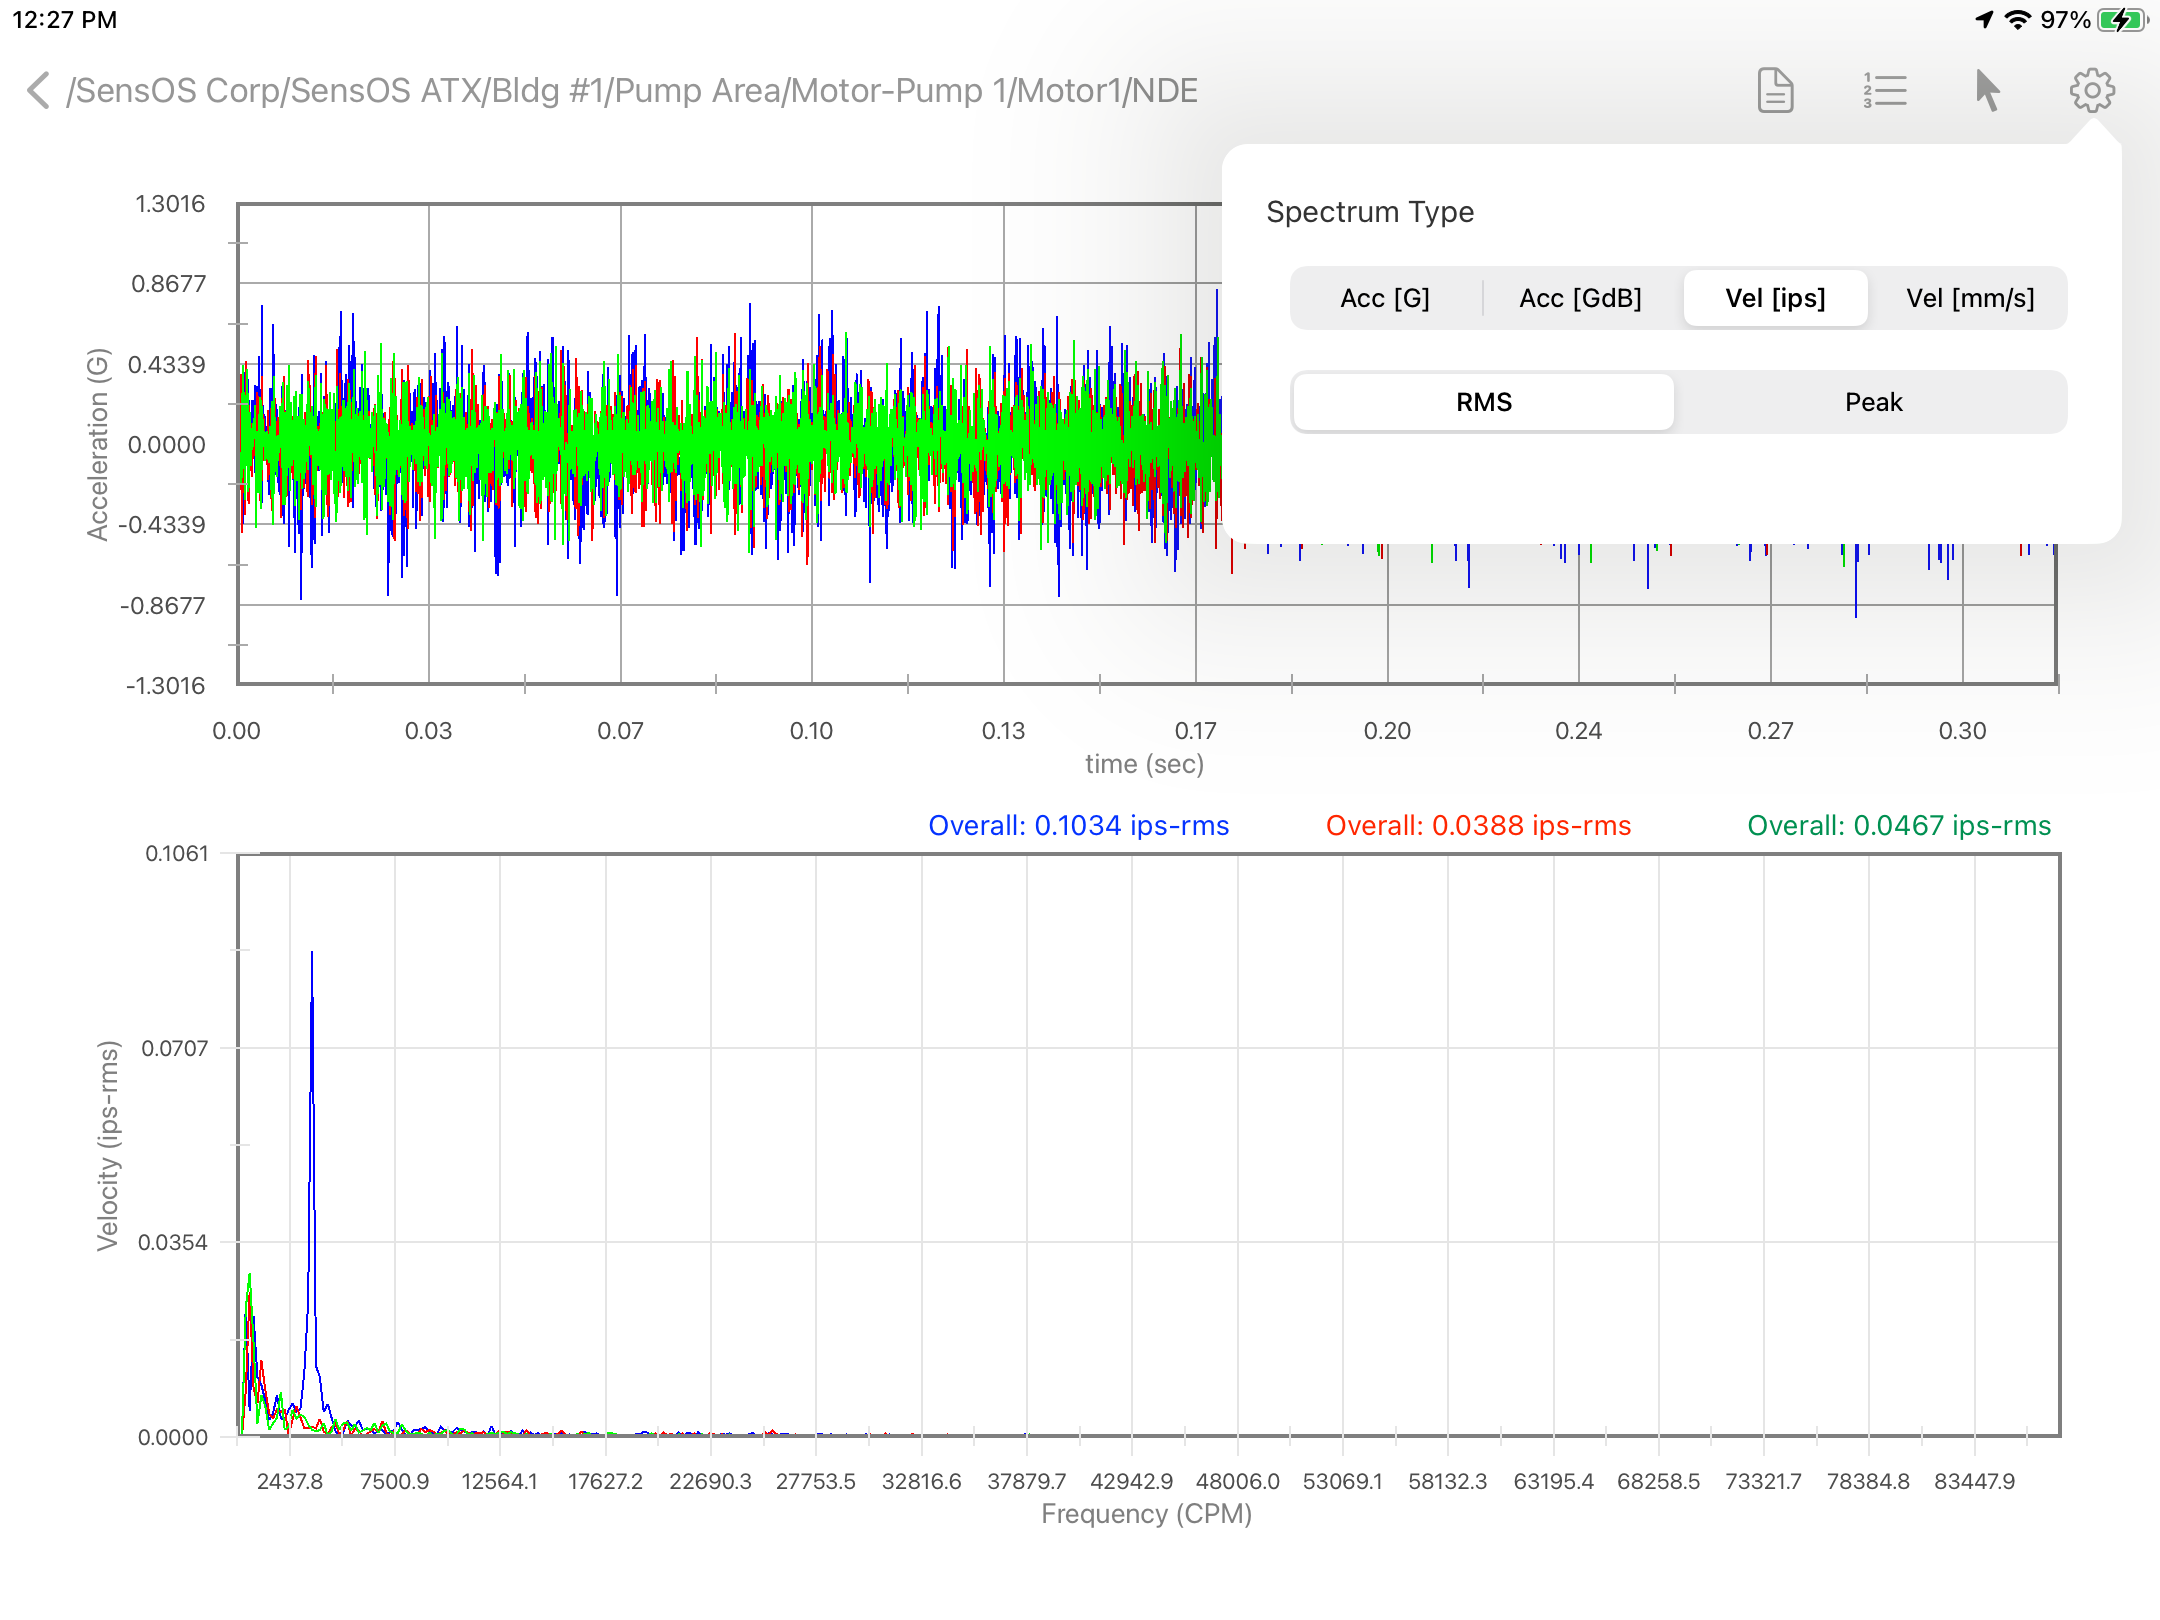
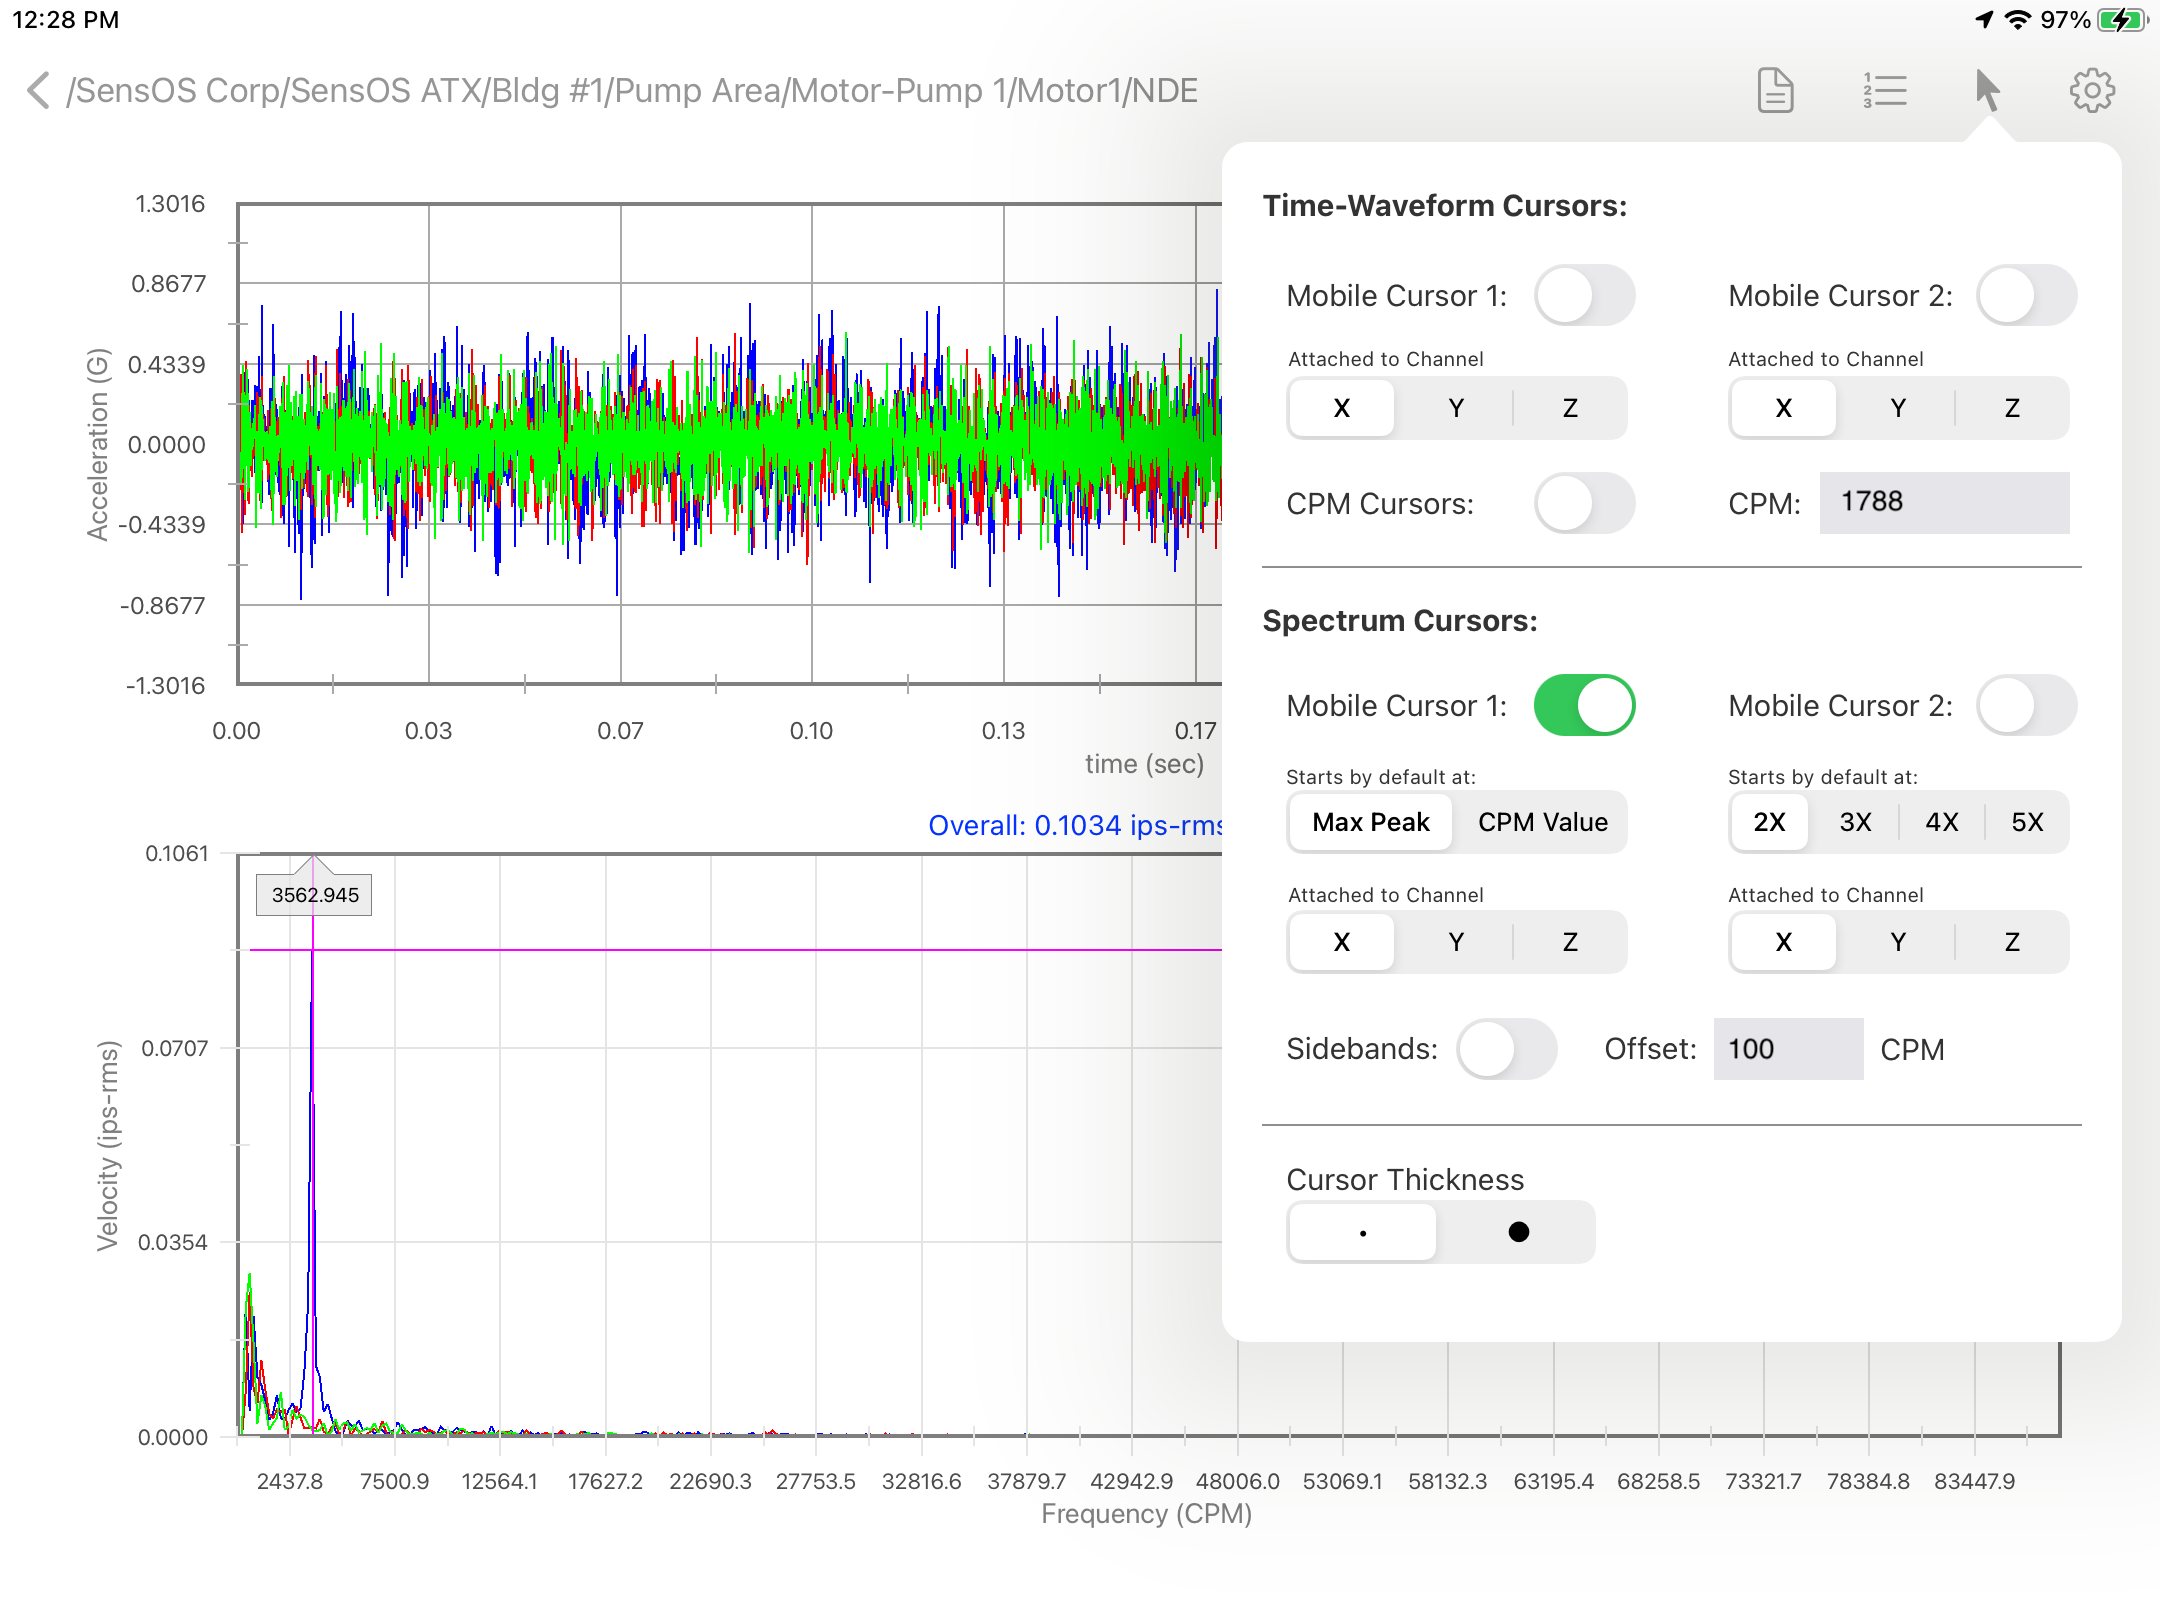
- The settings button will open a pop-up where the user can toggle the spectrum type between acceleration/Velocity, and can also change the amplitude from RMS to Pk and viceversa. To change the amplitude and frequency units see the Configuration section.
- The cursors pop-up will allow the user to add manual cursors or the CPM cycle cursor to the time-waveform. The user can add a single manual cursor or a dual manual cursor by turning each switch on/off. User can select the channel to attach the cursor (in the selector below the cursor switch), in order for the cursor to follow the X, Y or Z plots. Spectrum cursors are also available, by selecting the manual cursor 1, the user is given the option to automatically place it on the higher peak or on the entered CPM value. The vertical (frequency) cursor can be draged manually to the left or right, the horizontal (amplitude) cursor will follow the plot (on a triaxial plot, the user can select the axis to which the cursor is attached). A second cursor can be added and moved manually, but can also be set as an harmonic cursor. Sidebands cursors can be added and an initial offset entered in the offset field.
- Pressing the stats button on the top menu bar, will open a pop-up view with the overalls and overall band values defined by the route point. The higher 10 peaks for each axis will also be listed.
- A full pdf report can be generated, saved or sent by clicking on the report button, see more info in: Generating a pdf Report.

Configuration
- From the Main menu, click the top left menu button to open the left drawer with more options. Select 'Configuration' from the left menu
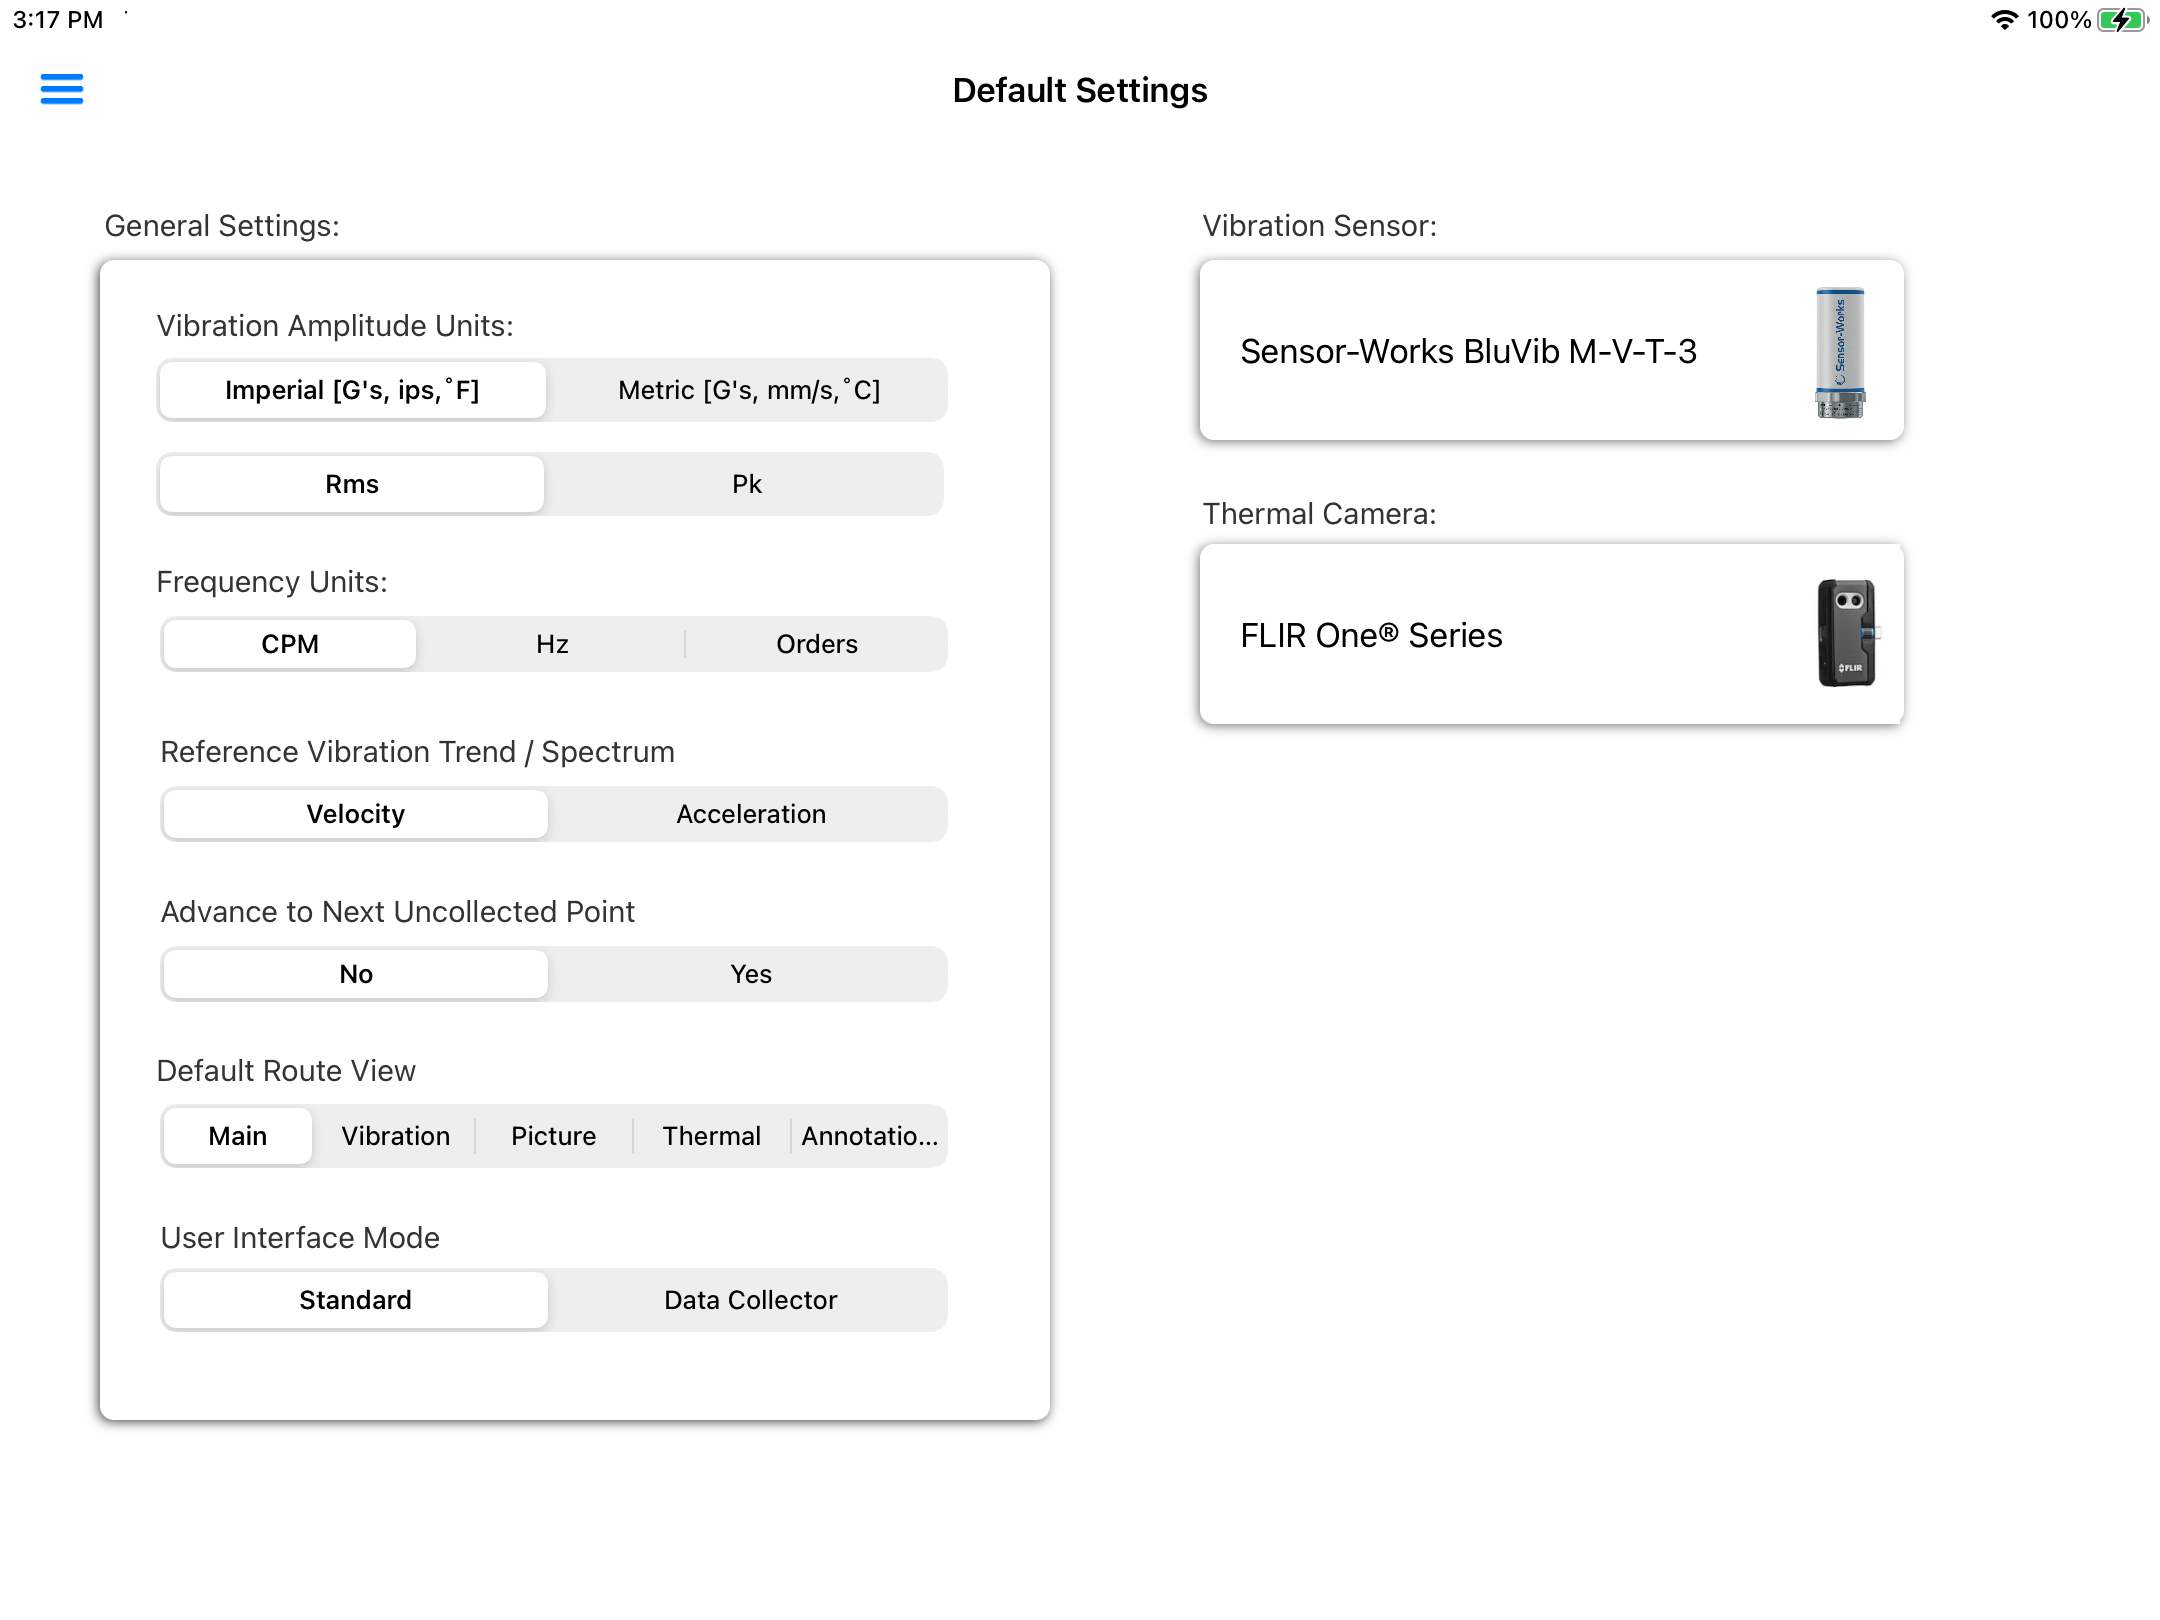
- The main configuration will allow the user to: i) Set the unit to metric or imperial, ii) Set the amplitude of the vibration to RMS or Pk, iii) Set the spectrum frequency units to CPM, Hz or orders, iv) Set the last readings trend default to acceleration or velocity, v) Set to manually advance to the next uncollected point in the route, vi) Set the initial screen that will appear when goinf into the route, vii) Set the Data Collector user interface type, viii) Select the type of vibration sensor, and ix) Select the type of thermal image camera.
- Press on the Vibration Sensor Cell to open a pop-up with a list of all avaialble sensors. Select the sensor to be used.
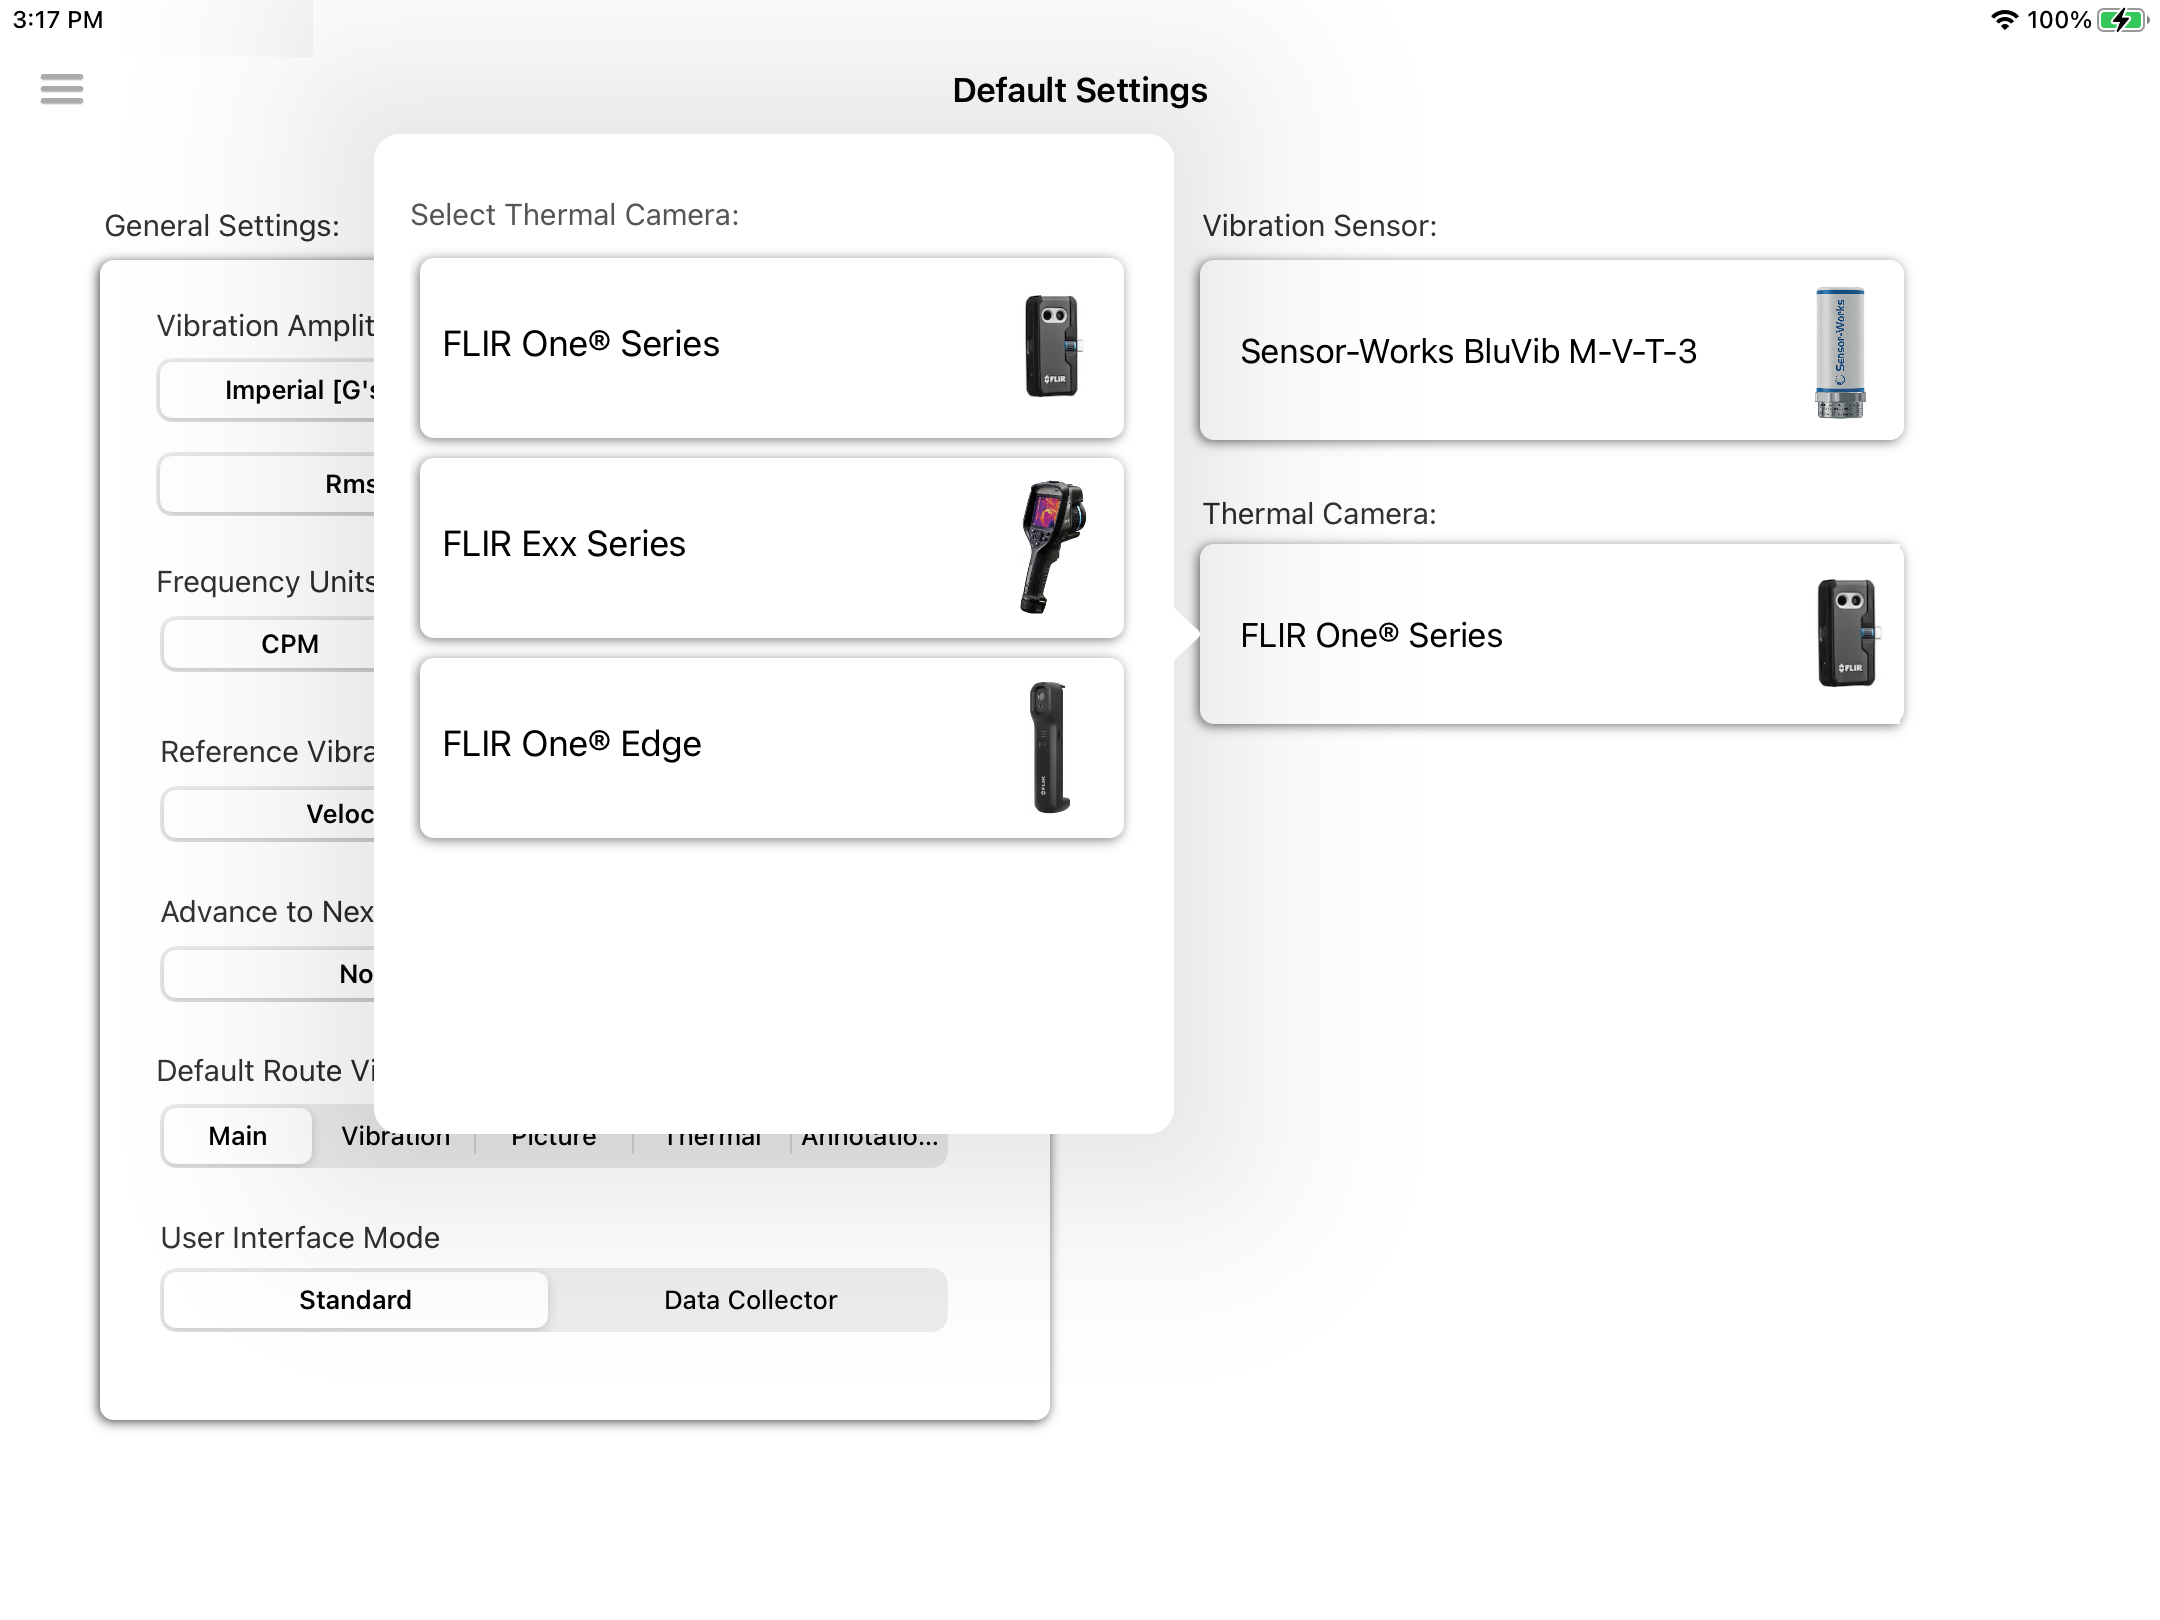
- Press on the Thermal Image Camera Cell to open a pop-up with a list of all avaialble cameras. Select the camera to be used.
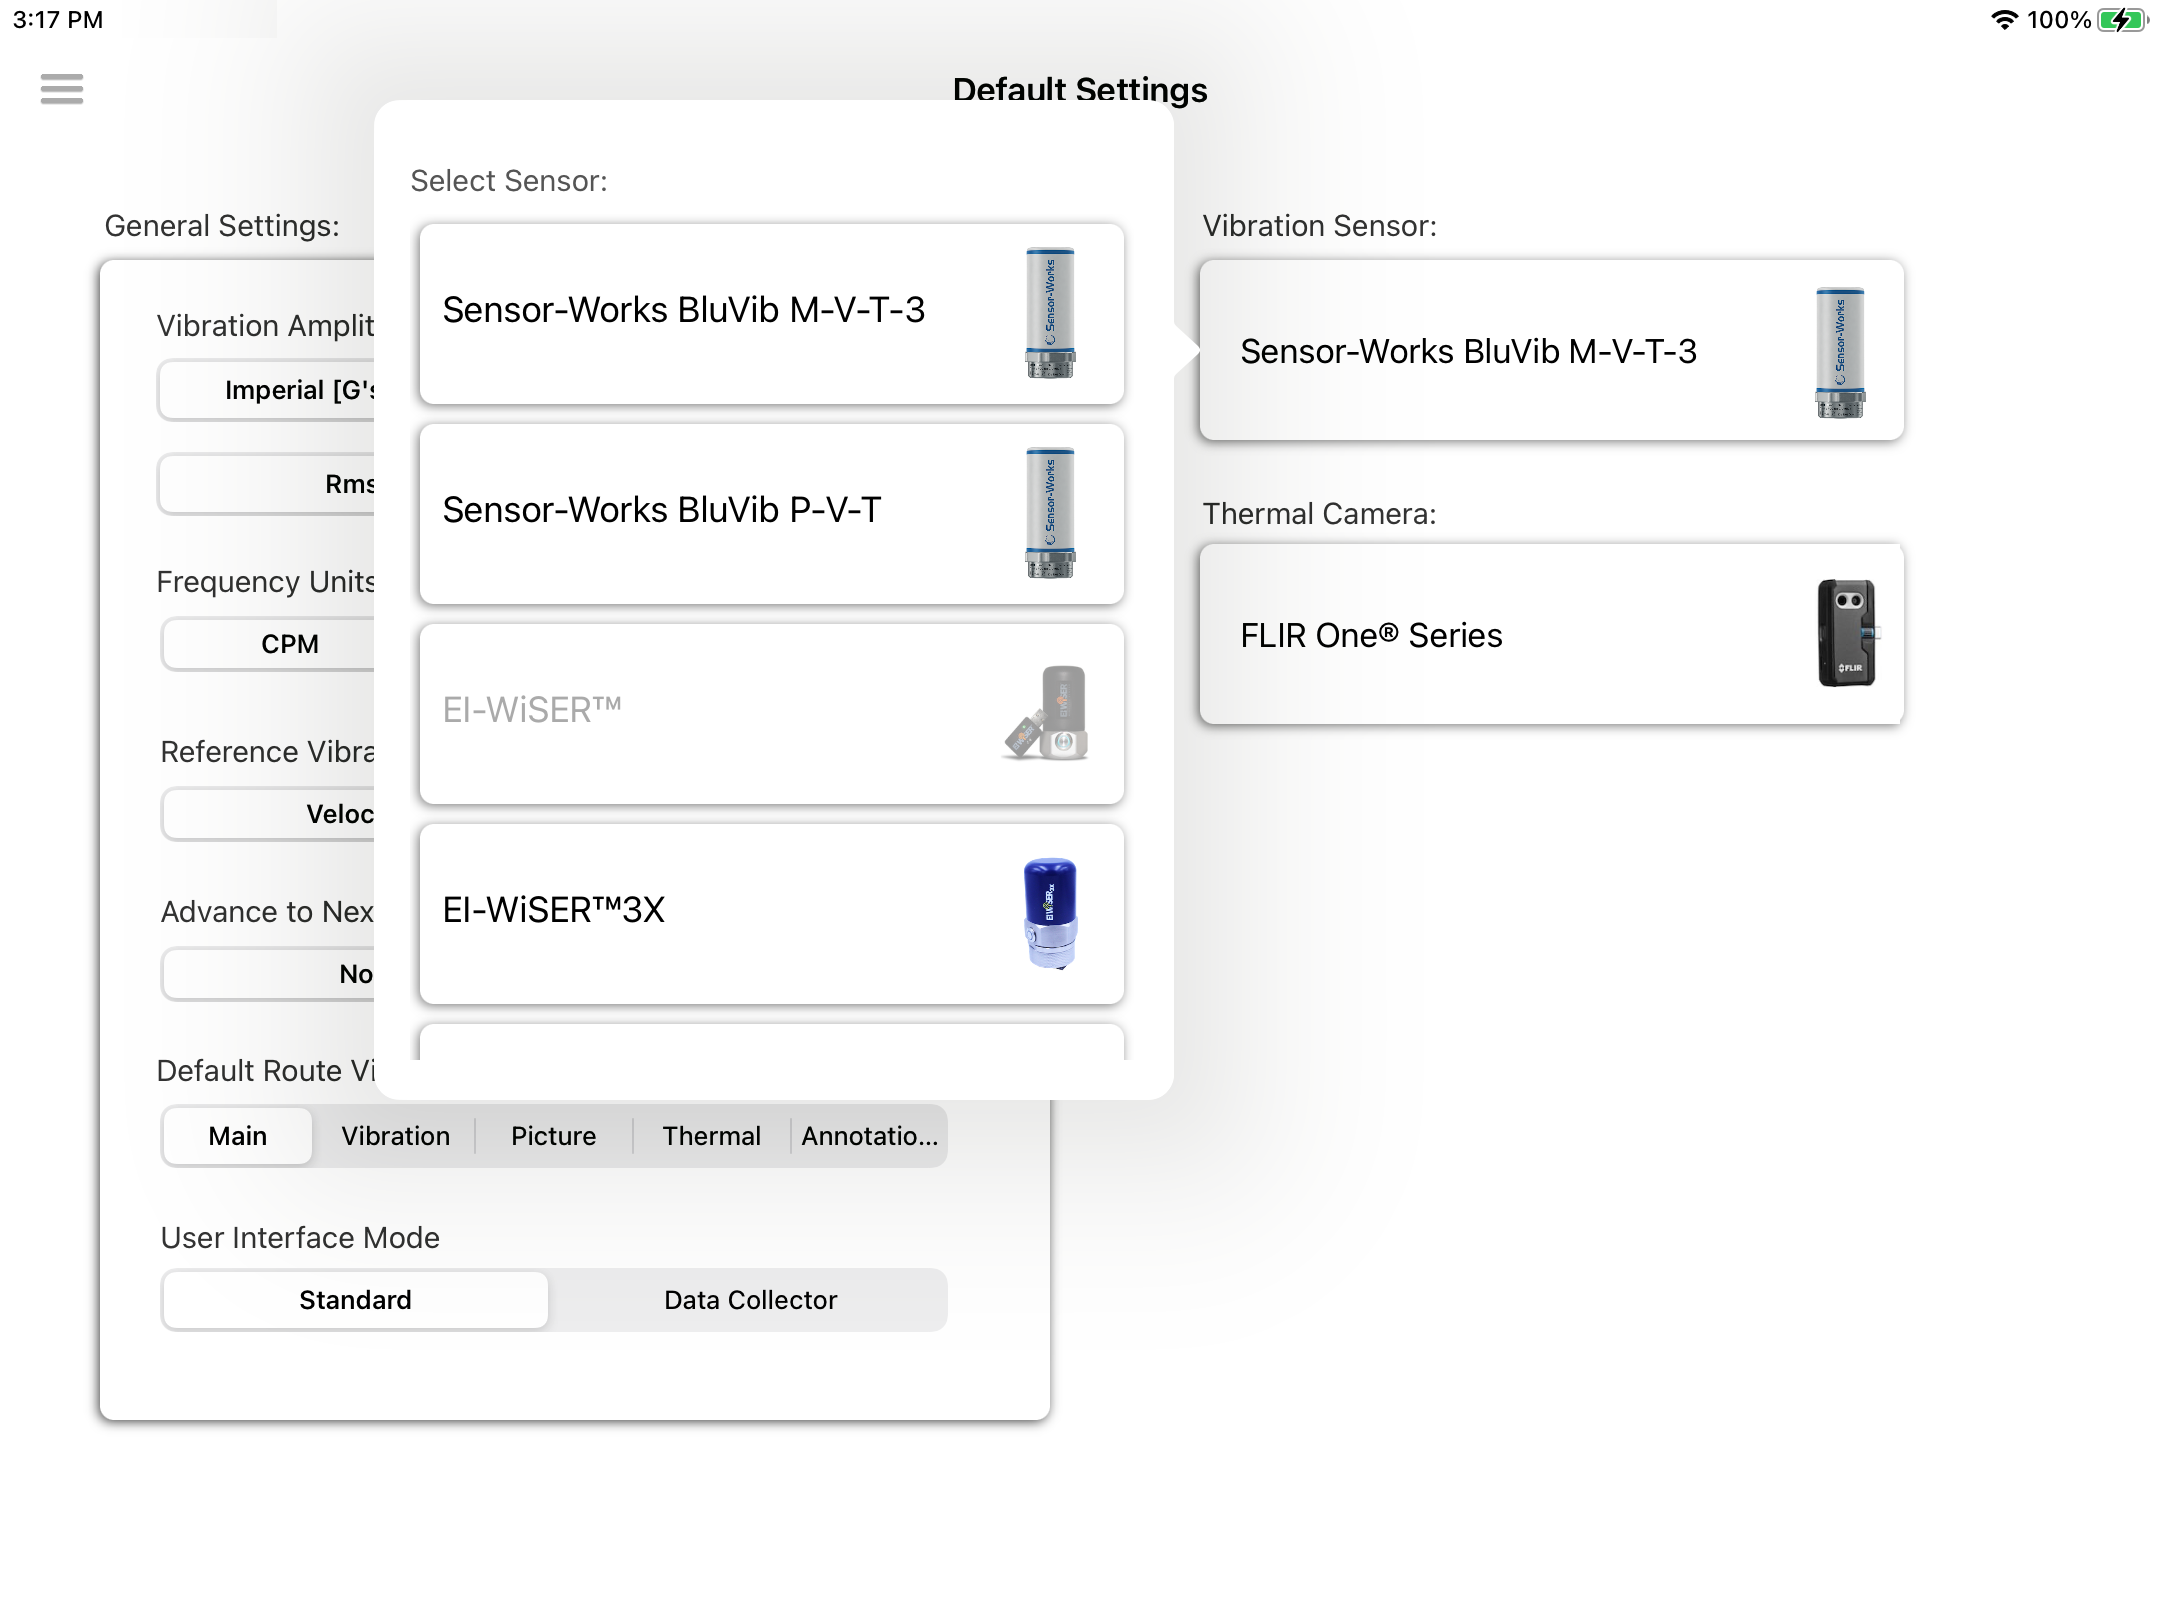
Note: This selection will affect all raw data readings for all modules
Report
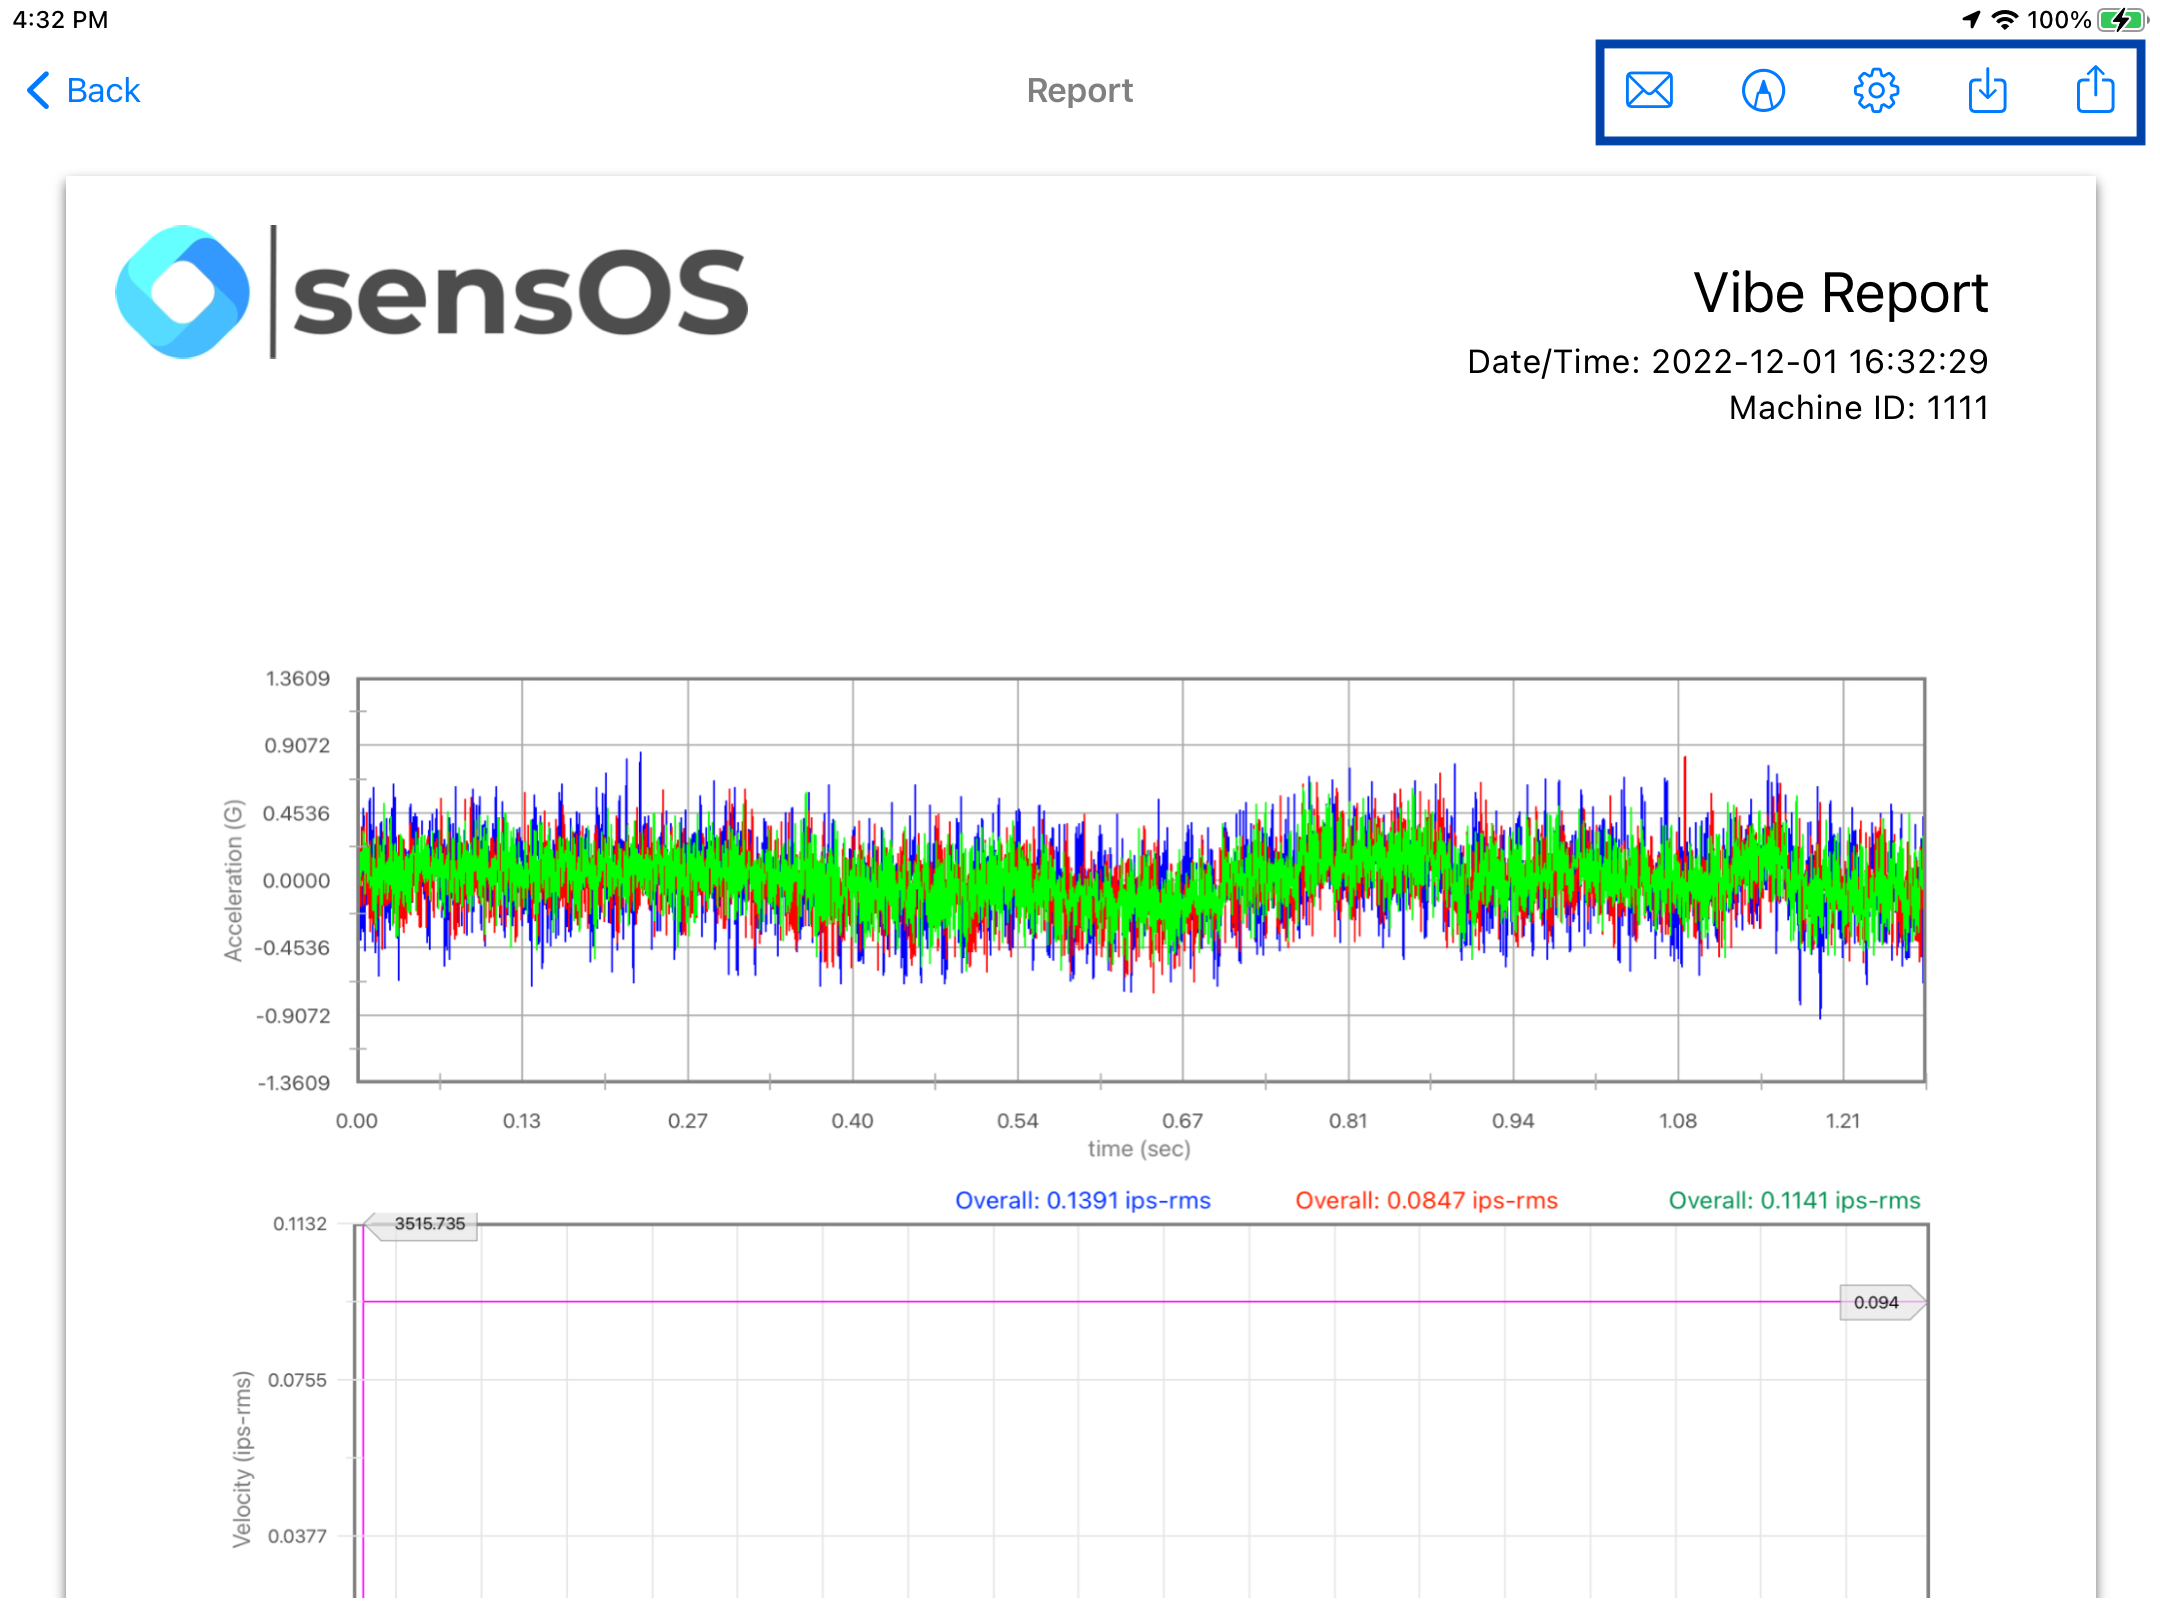
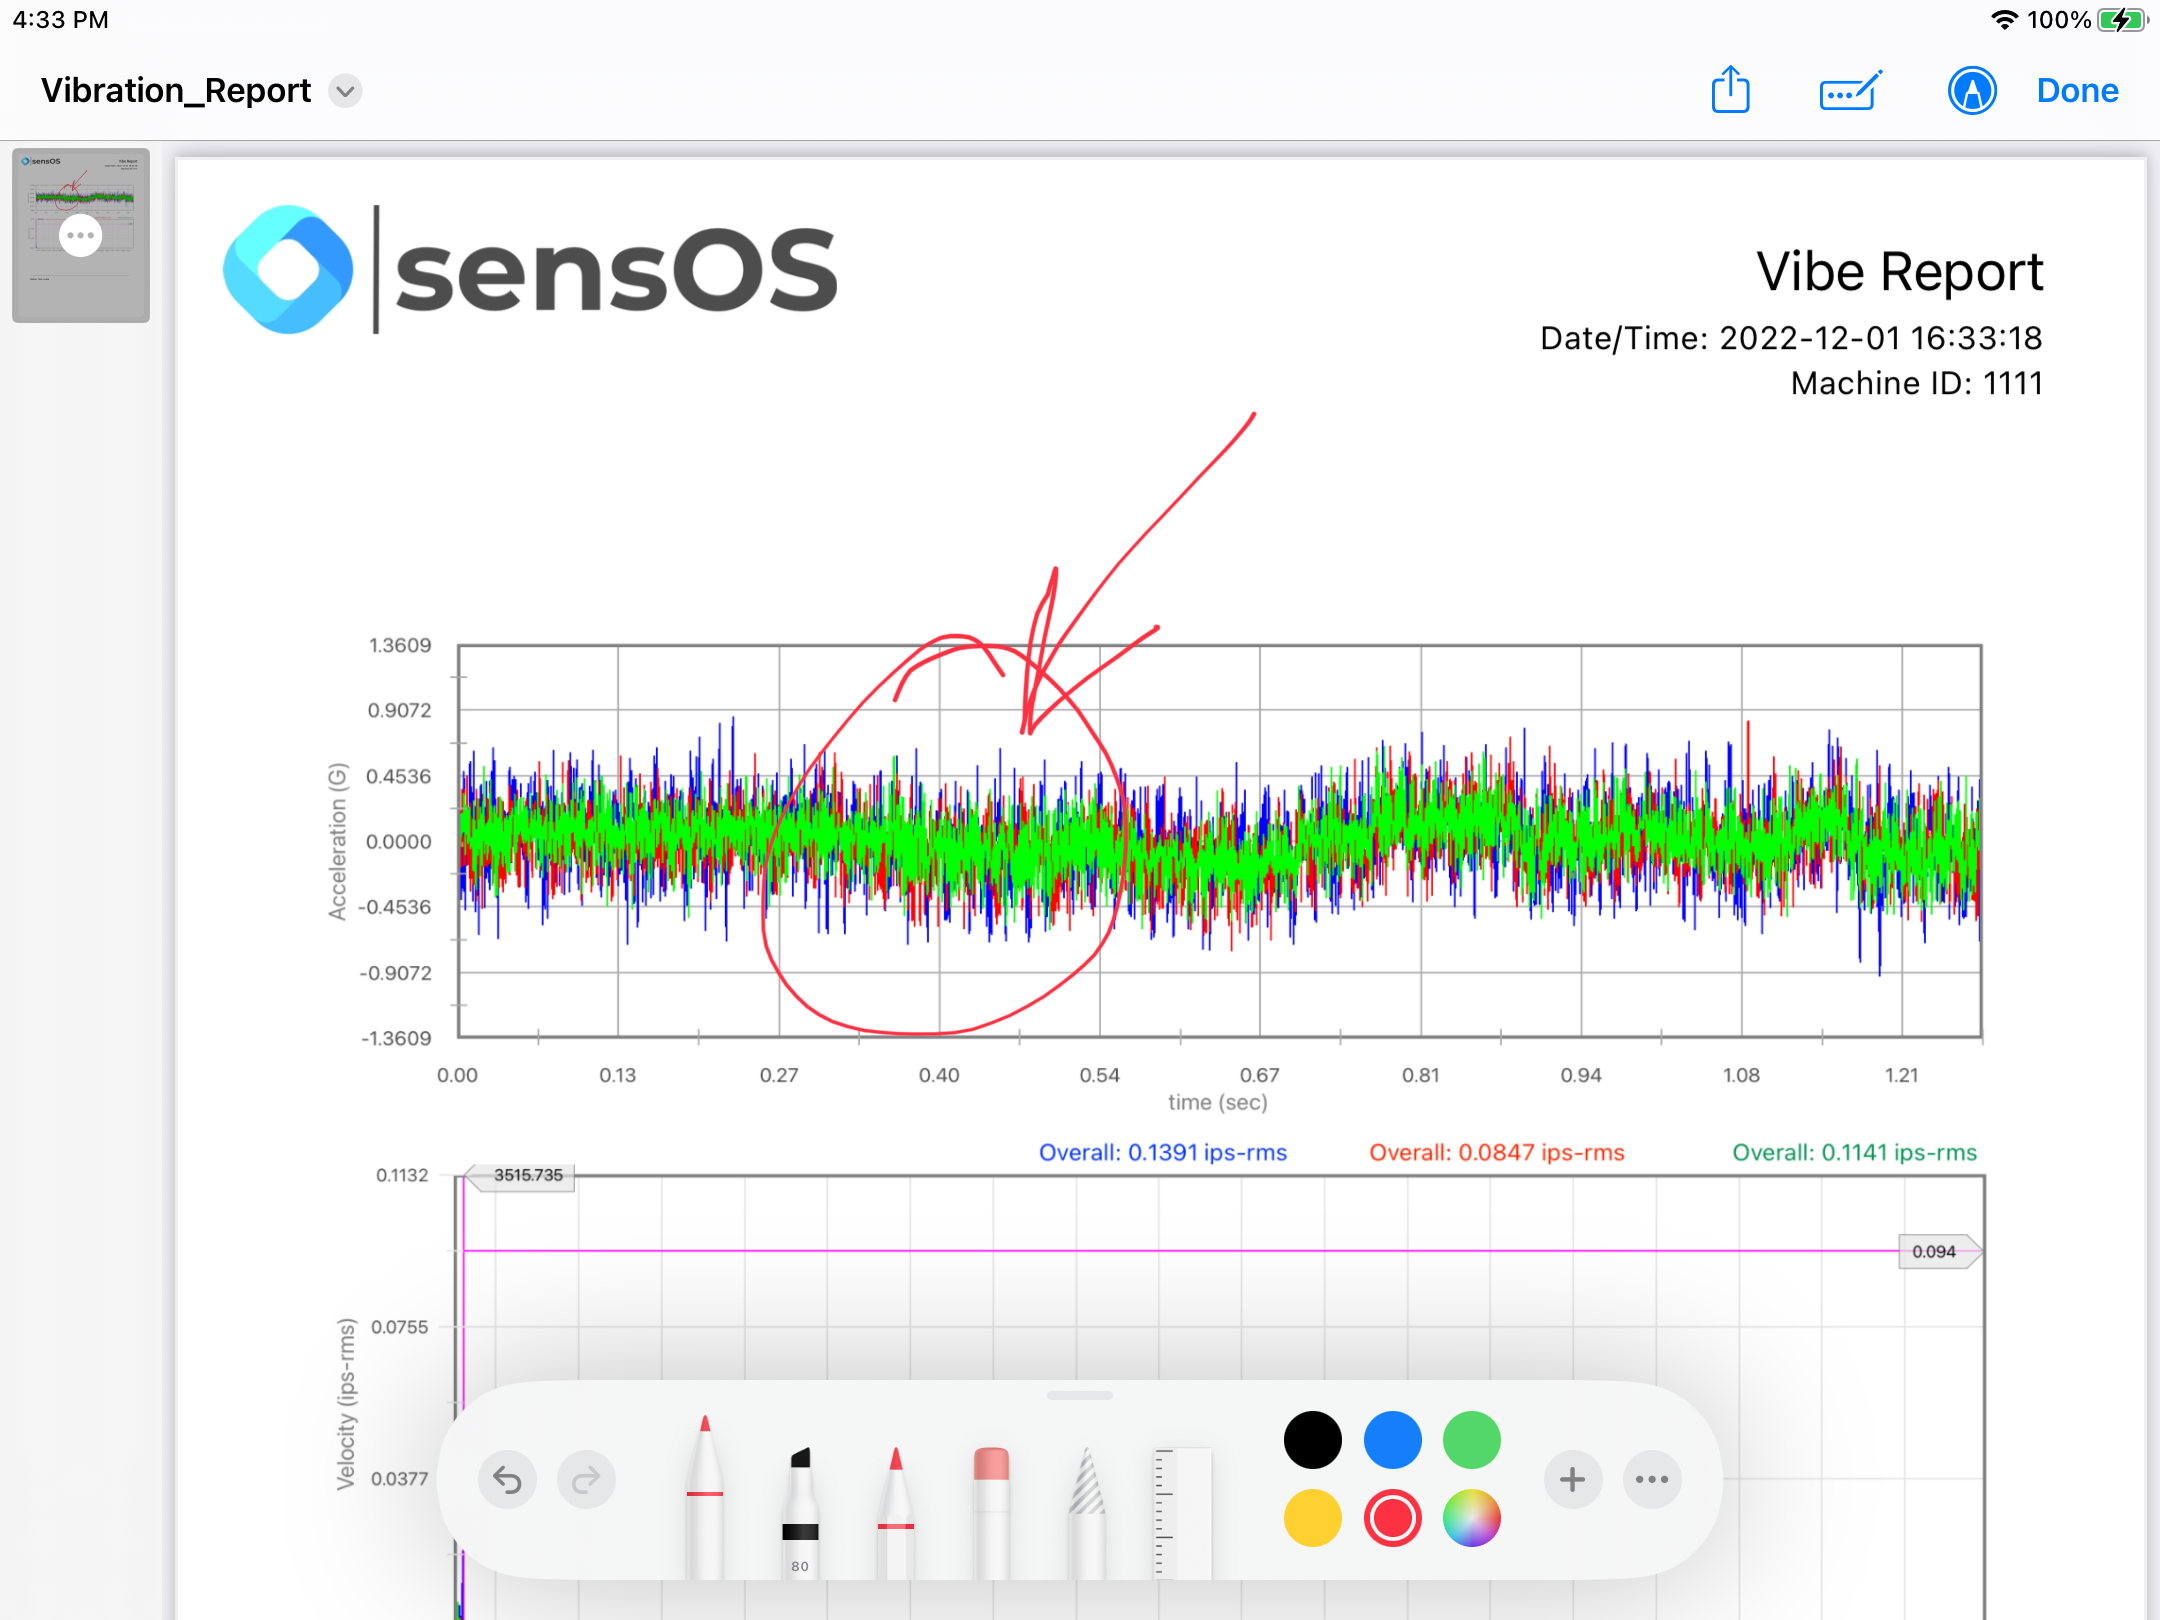
- Clicking on the Report button will open a new view with the pdf report. The report view contains several options in the top bar menu: 1:Send by Email, 2:Markup tools, 3:Report Configuration, 4:Save report locally, and 5:Upload Report to MS Cloud bucket
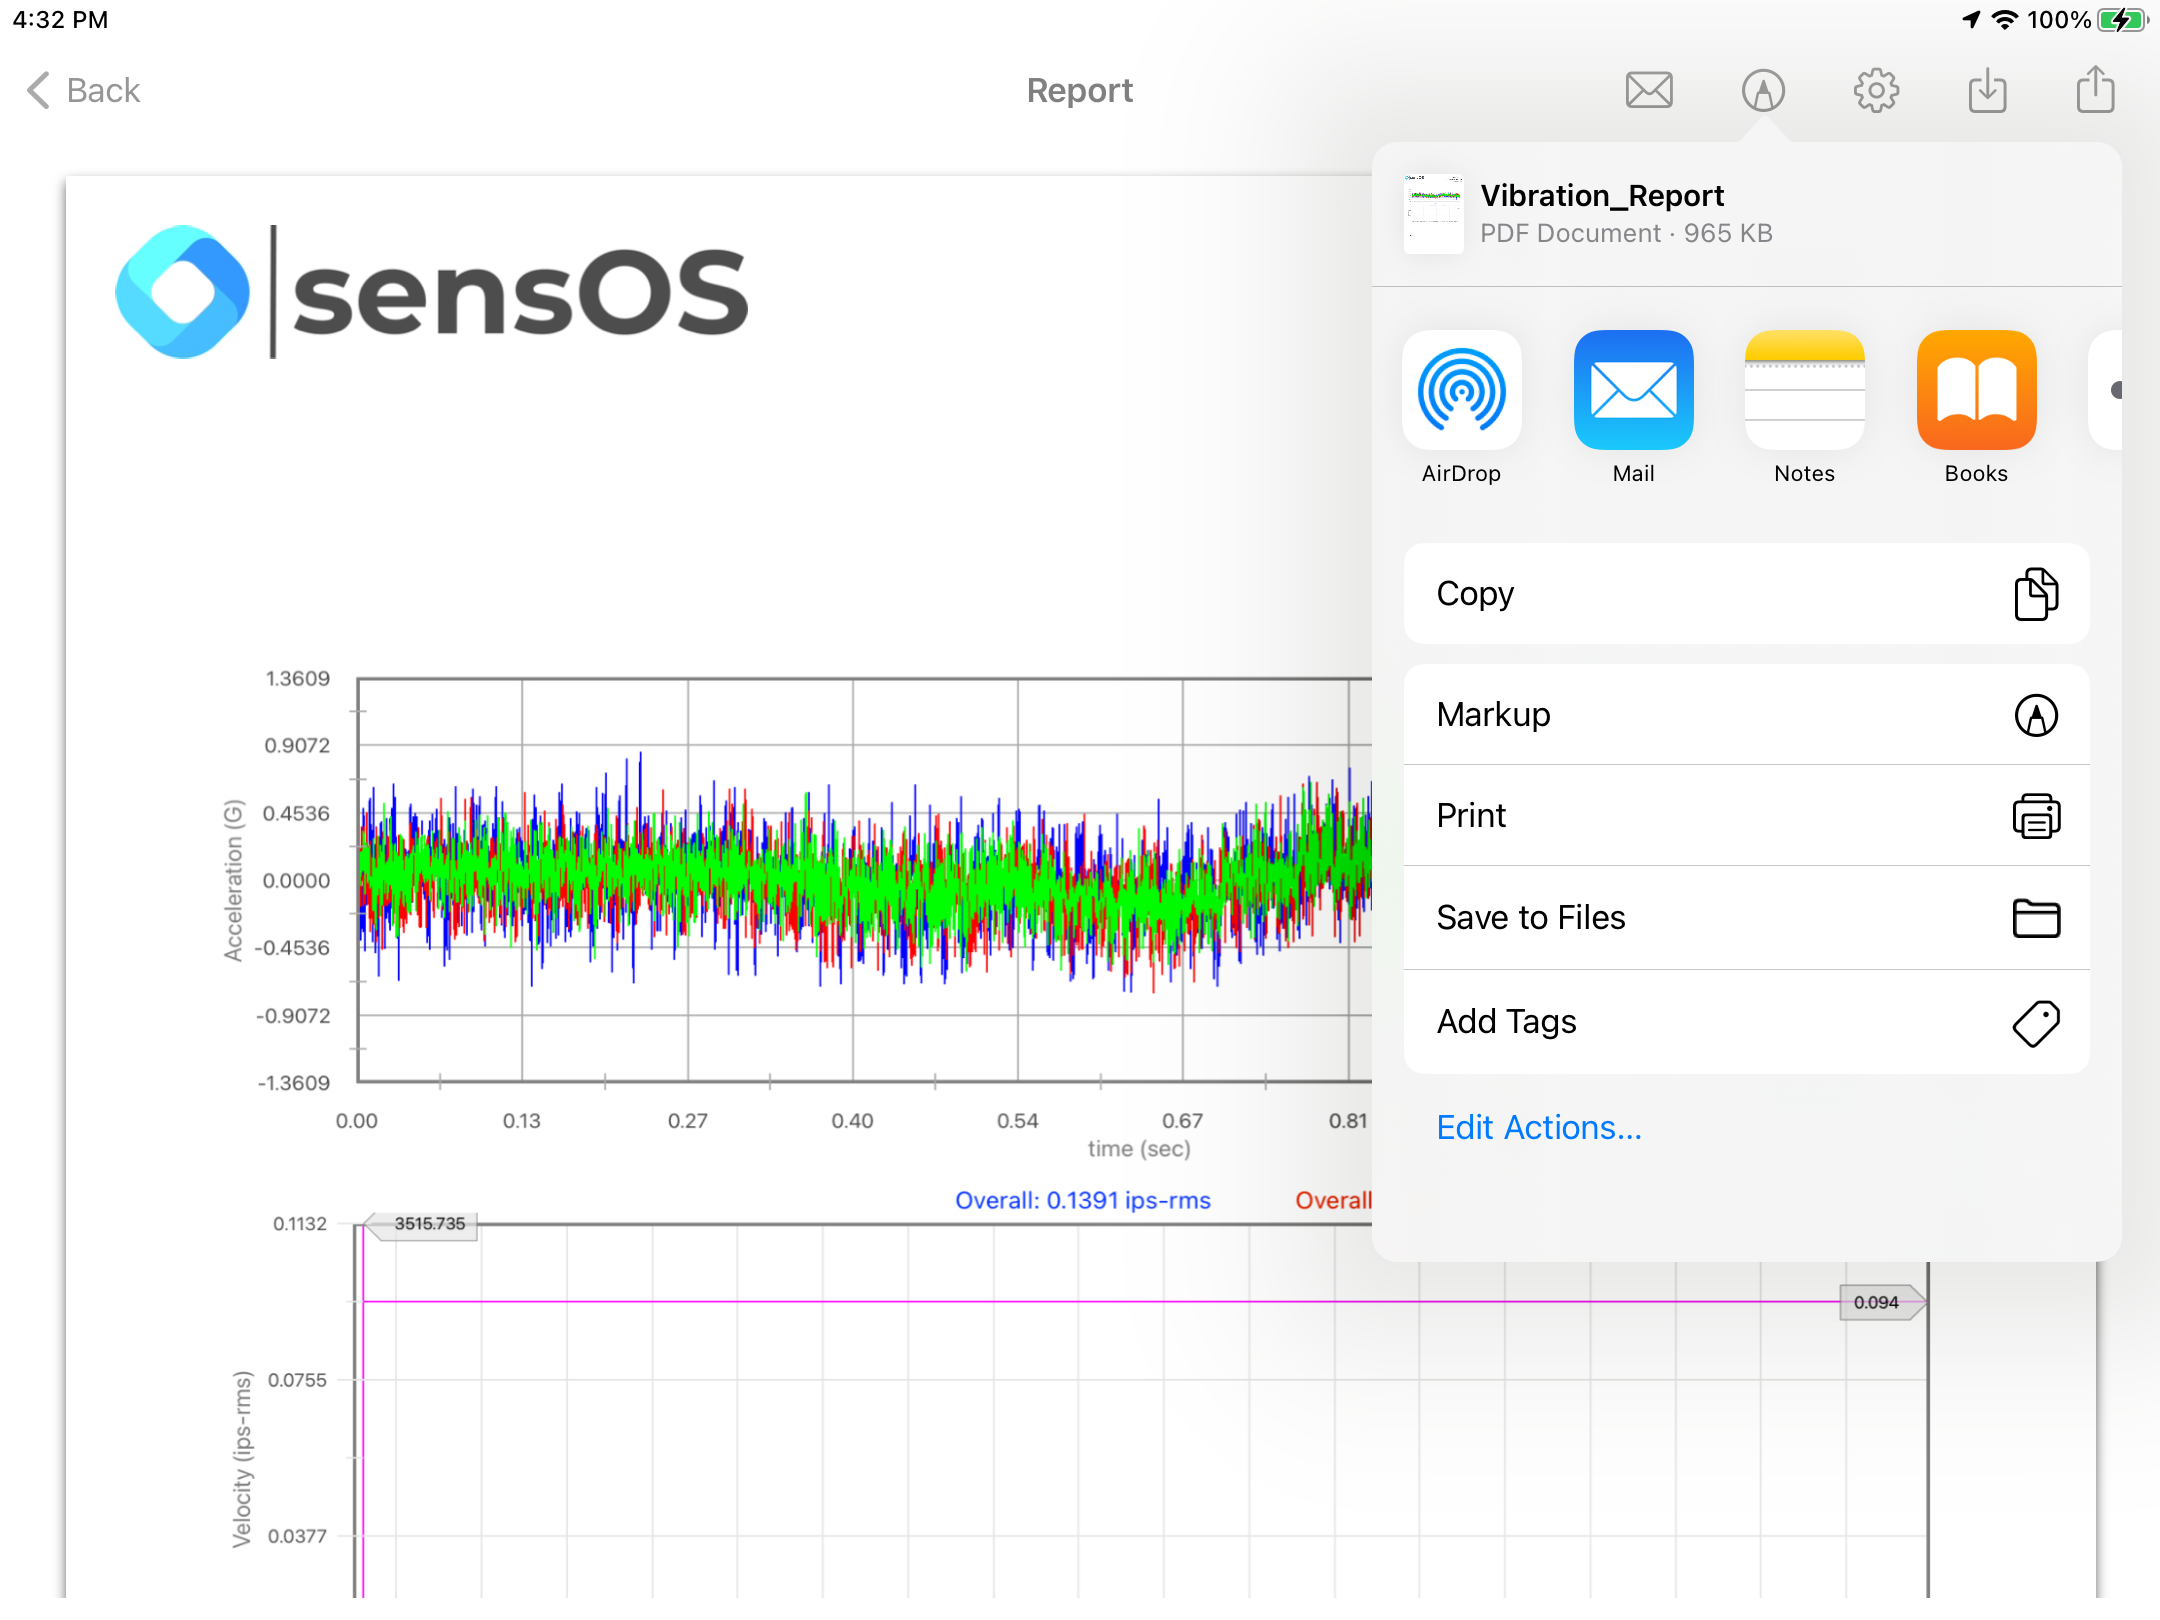
- The markup tool allows the user to copy the report to the clipboard, send it by Airdrop or any other messaging app, email it, print it or saved it to Files. The markup tool will open the standard tool to paint on the pdf report.
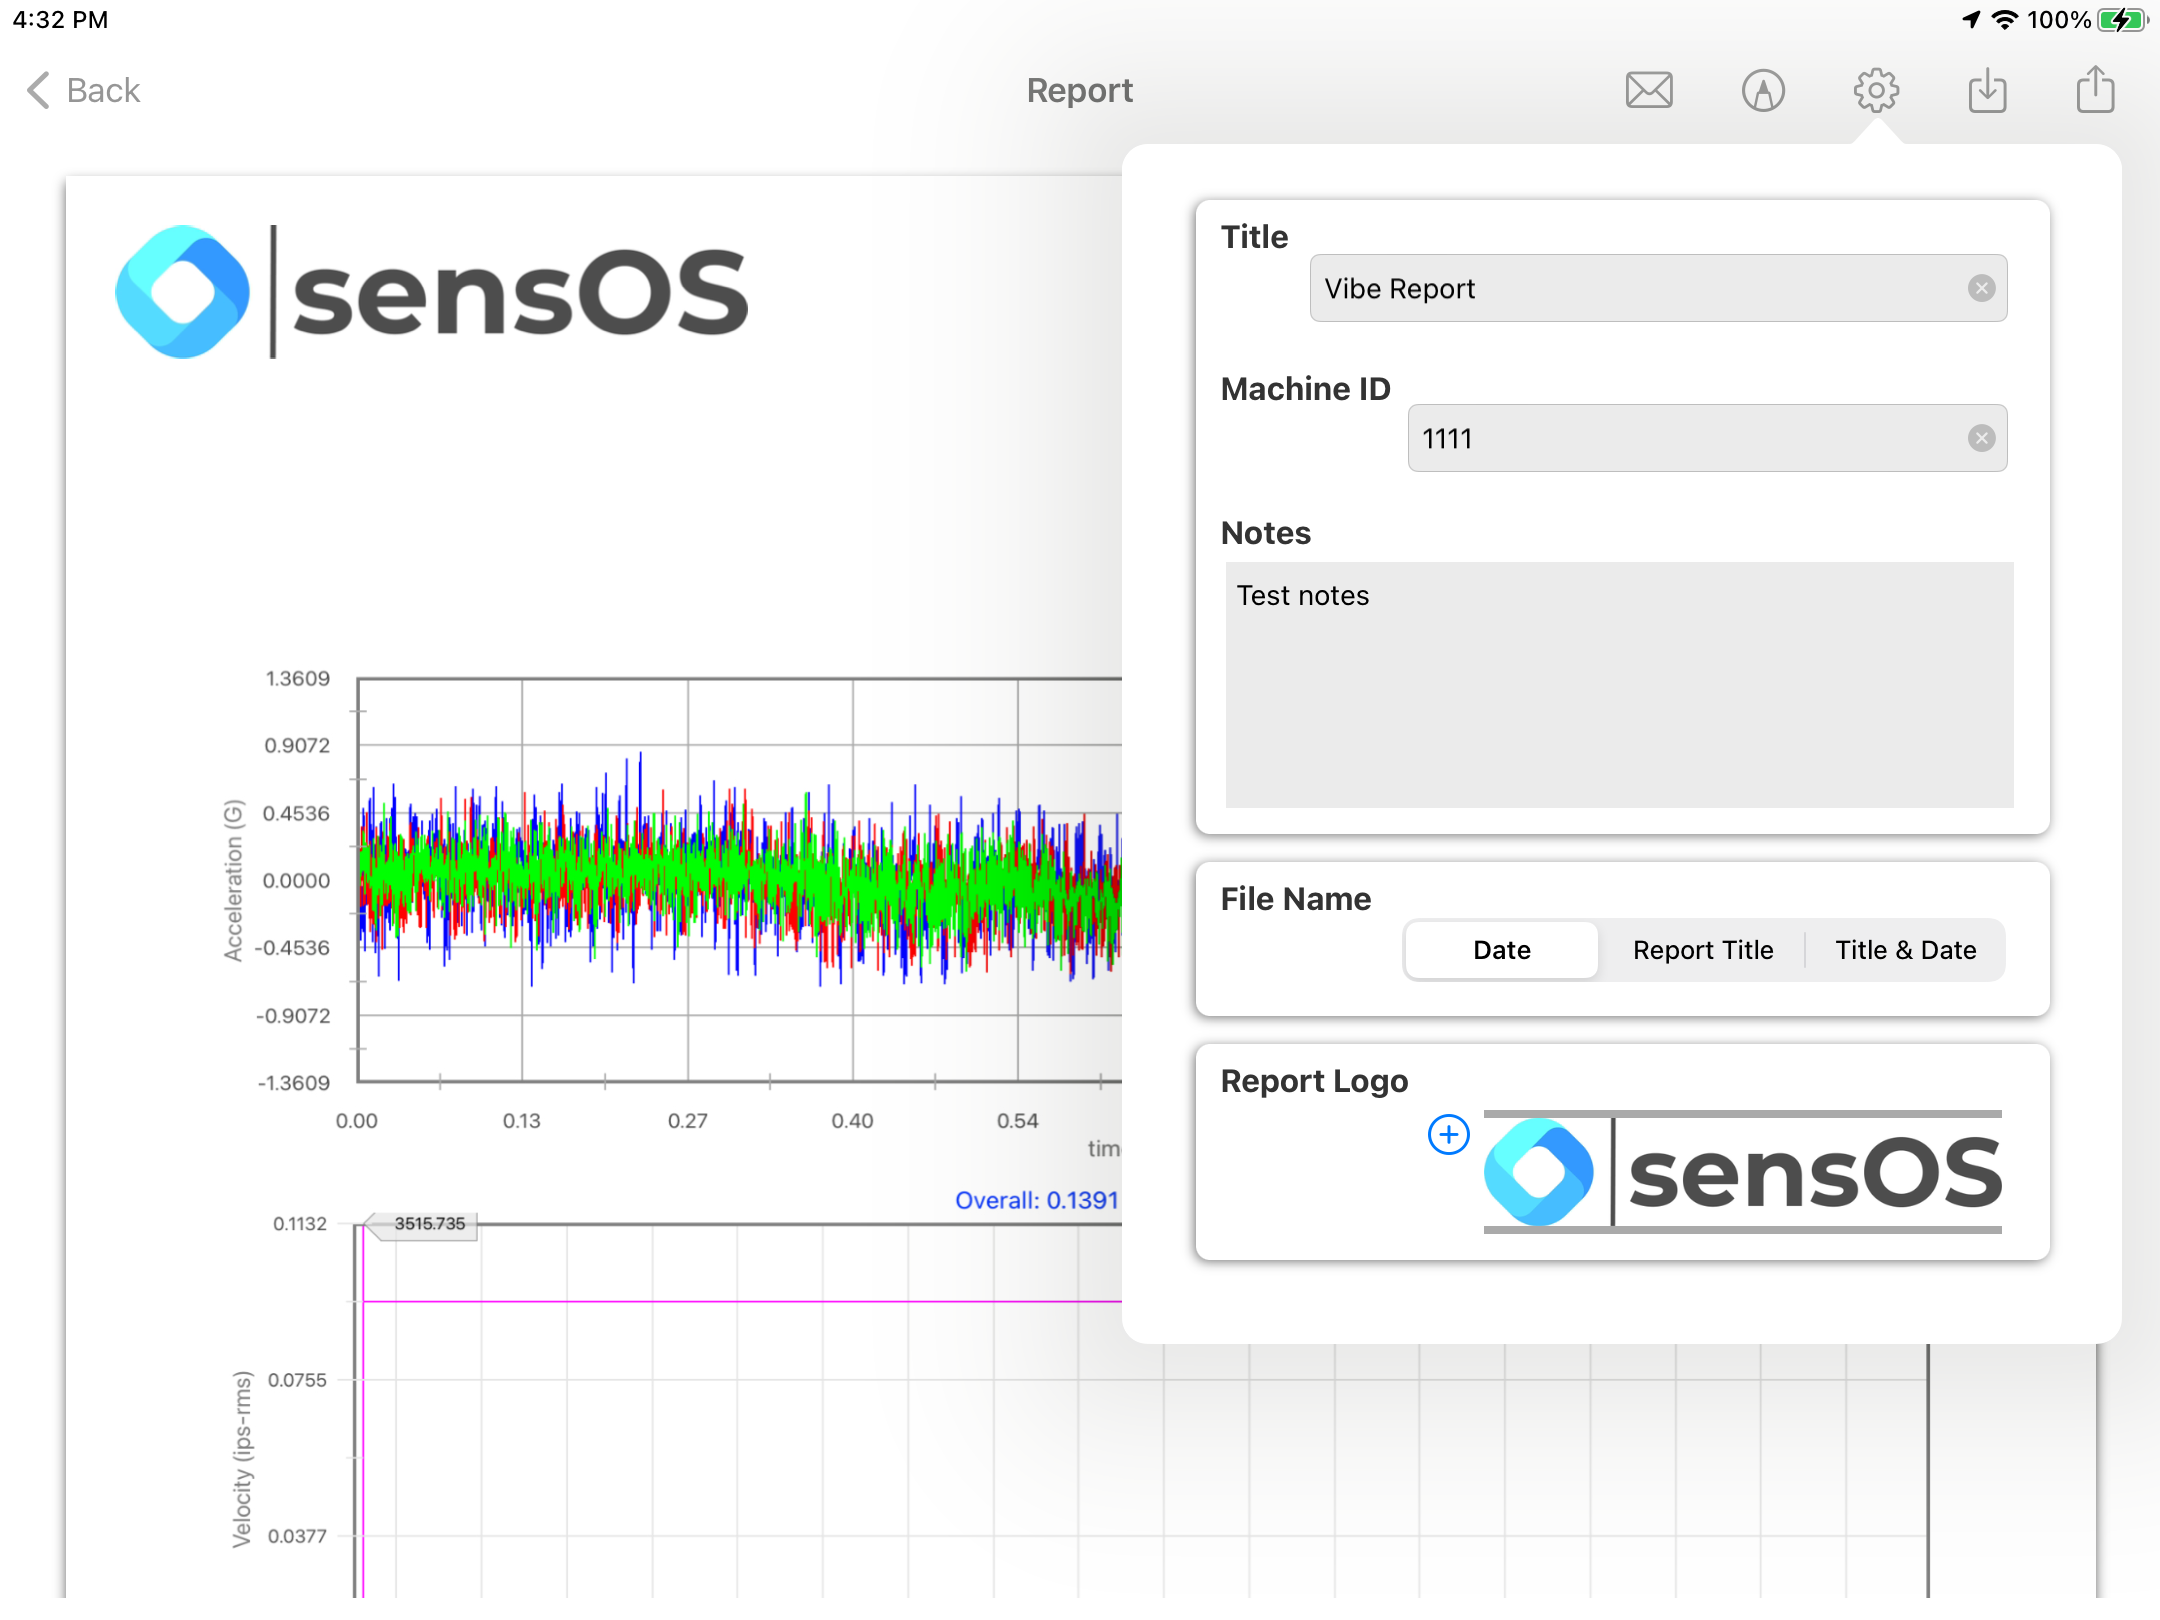
- The Report Configuration pop-up allows the user to enter the Report Title, Machine ID and Notes to be added to the report. Here the user can also select a logo for the report. The report file name be default is the actual date and time, but the user can change it to the title name of the report or to both, the title name and date.
- Optimized Optimized for iPadOS 16
- Fixed Support for FLIR ONE® Edge Wireless Thermal Image Camera
- Fixed Axes orientation for Sensoteq Chi BLE sensors
- Added Thermal Image streamer for FLIR wireless thermal image cameras
- Added Discrete frequency calculations to the vibration viewer
- Fixed Thermal Image dynamic temperature scale & Route Data from EI-WiSER™3X
Changelog
See what's new added, changed, fixed, improved or updated in the latest versions.
Version 1.10 b.72 (22 Nov, 2022)
Version 1.09 b.70 (15 Nov, 2022)
Version 1.08 b.69 (04 Aug, 2022)
Version 1.05 b.66 (18 Mar, 2022)
Version 1.04 b.65 (04 Mar, 2022)
Version 1.02 b.59 (24 Feb, 2022)
Version 1.01 b.57 (04 Feb, 2022)
Initial Release