Documentation
Polar Time-Waveform
MS-3933: Vibration Analysis Studio Android™ version
- Version: 1.18 (b.94)
- Author: D. Bukowitz
- Created: 18 May, 2021
- Update: 21 Sep, 2022
If you have any questions that are beyond the scope of this document, Please feel free to email via info@sens-os.com
Description
This feature plots a time-waveform cycle in a polar plot, allowing vibration analysts to detect fault patterns in rotating components such as Gears.
Compatibility
This module is compatible with the following sensors:
- SensorWorks BluVib P-V-T (1-Axis)
Polar Time-Waveform
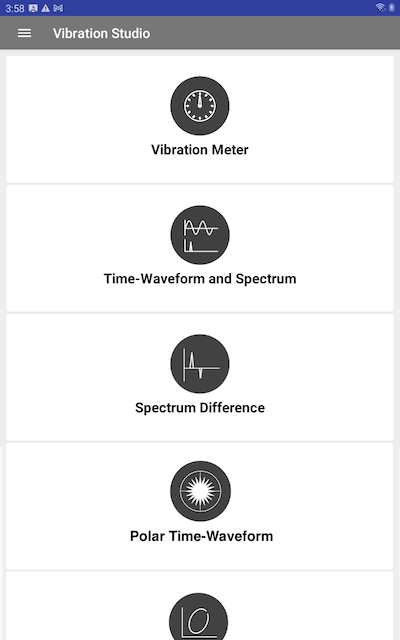
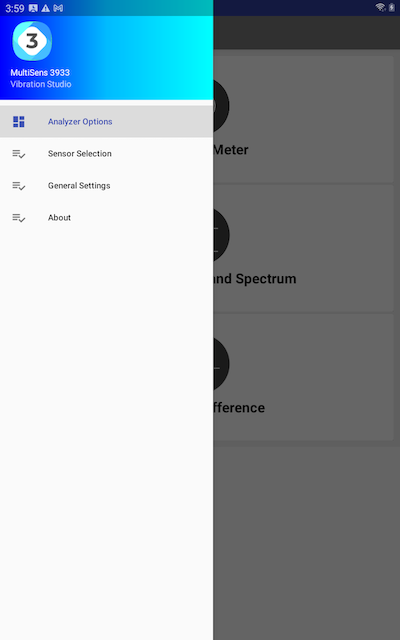
- From the main dashboard, open the left drawer (Click the hamburger button) to see the options menu.
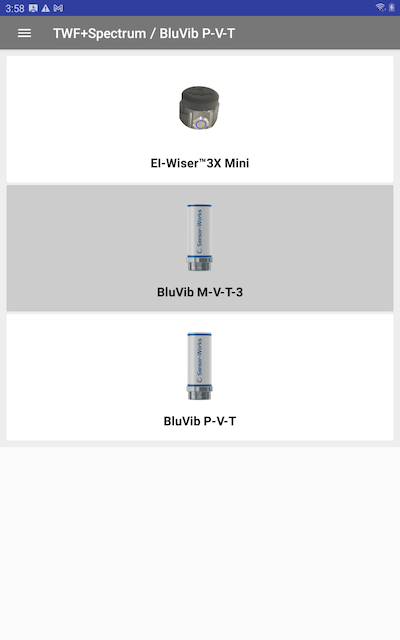
- On the left drawer menu, select "Sensor Selection"
- On the Sensor Selection view, click on the sensor.
- Open the left drawer again and click on "Analyze Options" to go back to the list of Tests.
- On the main dashboard, select the "Polar Time-Waveform" option.
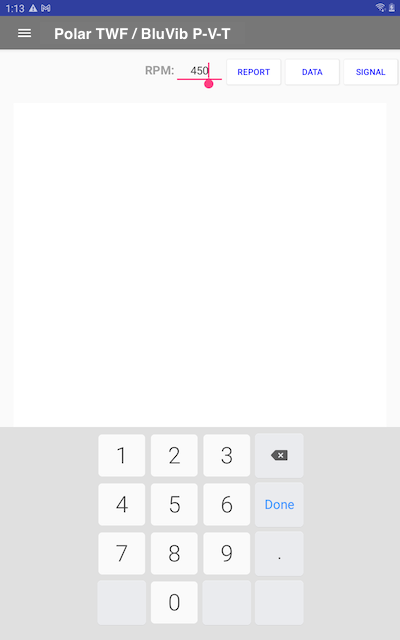
- The view will open and the device will scan for a wireless sensor. Enter the RPM on the top bar field and click on Done in the keyboard.
- Once connected to the sensor, the start button will be enabled. Place the sensor on the asset and press the Start button and collect data.
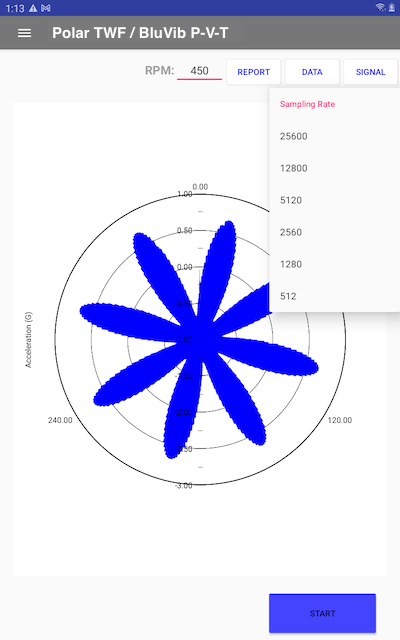
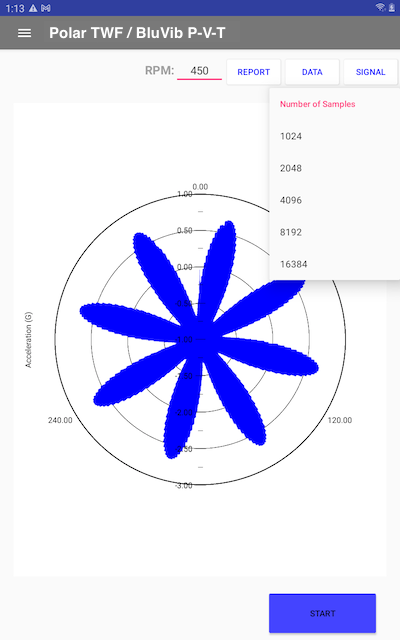
- The sampling settings can be changed under the "SIGNAL" tab. Here the number of samples and sampling rate can be selected based on each sensor characteristics. Also the measurement mode can be changed to single-measurement or continuous.
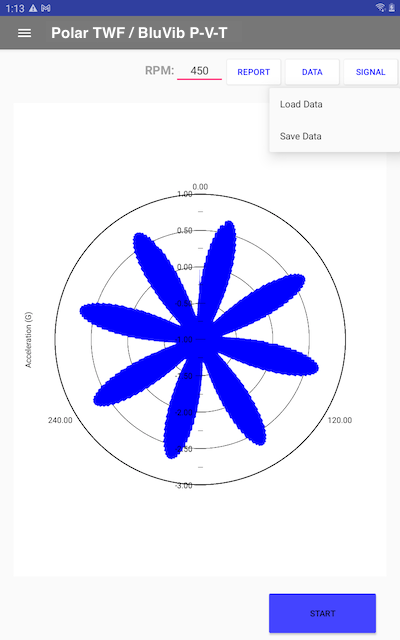
- The measurement data can be saved and later loaded, click the "DATA" tab and select load or save. See Save & Load Data for more details.
- A full pdf report can be generated of the measured data, press the "REPORT". See Report for more details.


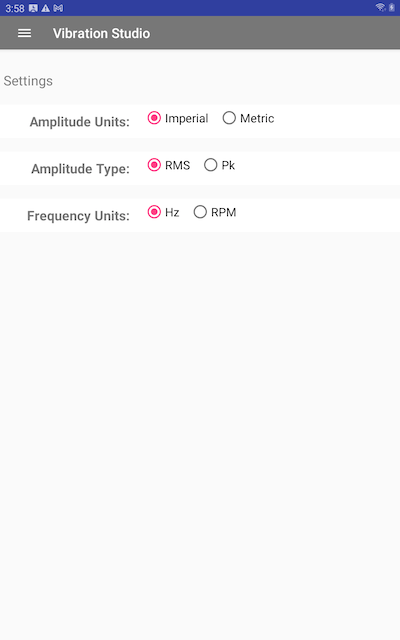
Configuration
- Open the left drawer (Click on the hamburger button on the top left). And select "General Settings.
- The Settings view will allow the user to set the units and amplitude type as defaults for all the modules.
Save & Load Data
- Open the left drawer (Click on the hamburger button on the top left). And select "General Settings.
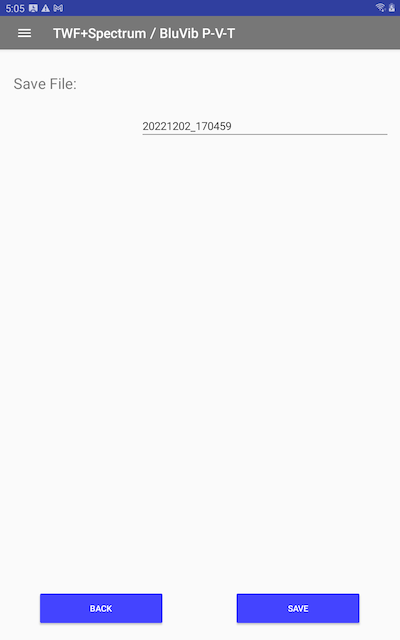
- Pressing the "Save Data" will open a screen with a field to enter the file name, by default the file name is the timestamp. After enetering the file name press the "SAVE" button.
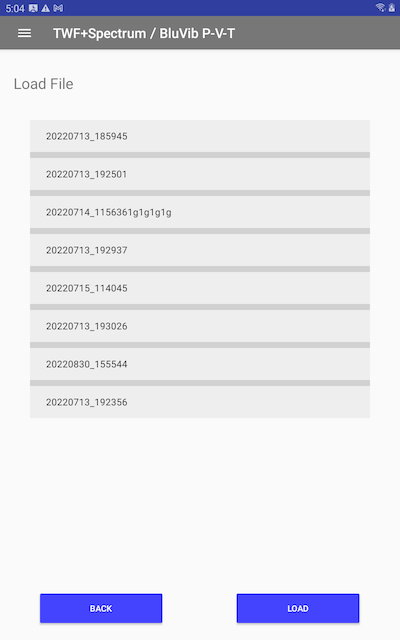
- Pressing the "Load Data" will open a screen with a list of all available files, click on the file to load. Press the "LOAD" button.
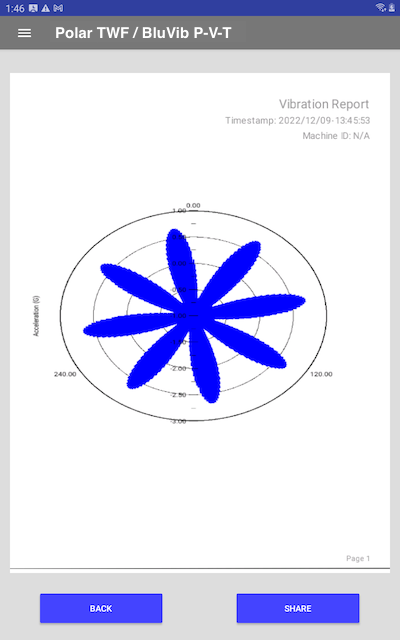
- Click on the Report button
- A pdf report will be generated with the polar plot and header information.
- Press the "SHARE" button to email the report or to save it locally.
- Optimized Optimized for Android 11
Report
Changelog
See what's new added, changed, fixed, improved or updated in the latest versions.
Version 1.18 b.94 (21 Sep, 2022)
Version 1.01 b.05 (18 May, 2021)
Initial Release