
![]()

Select an Analysis option or sensor to connect
-14+ vibration analysis tests -Rearrange the tests with a simple drag and drop -Select from a variety of commercial wired and wireless vibration sensors
Load/Save data and reports to the device, cloud bucket or cloud asset tree
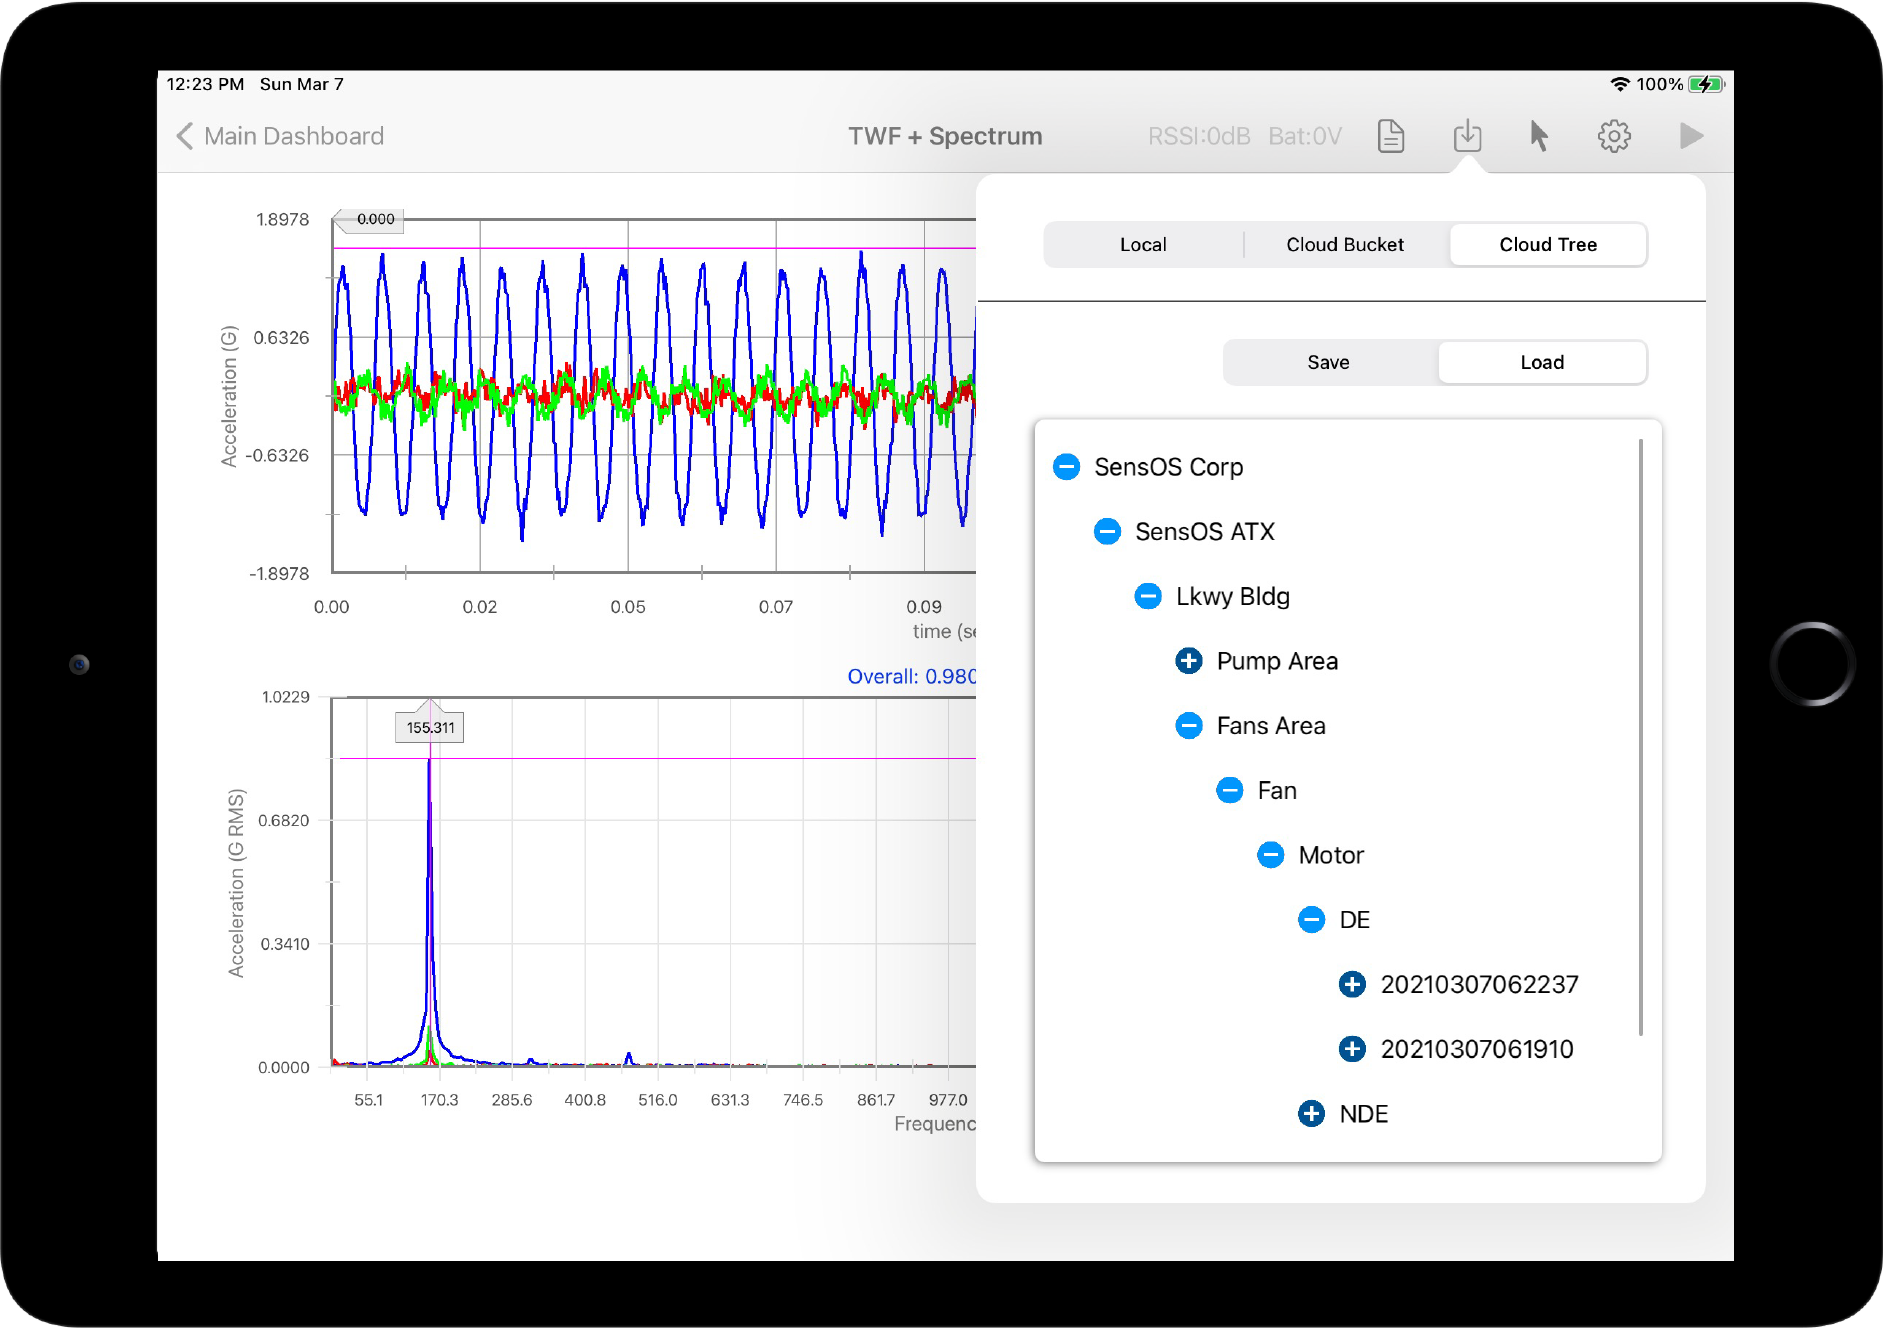
-Save/Load data directly from the cloud asset tree -Company asset tree can have as many levels as required -Save pdf reports and csv data directly to a cloud bucket -Save data locally while offline and upload later to the cloud and assign it to a machine
Triaxial Time Domain Vibration Analysis
-Real-Time Live triaxial TWF -Change data acquisition parameters: sampling rate, number samples, filtering, etc -Automatic high peak cursors, differential calculations for time and amplitude -Save/Load data or generate pdf report in one-click -Customizable cycle cursors
3D Vibration Analysis
-Real-time 3-Axis orbit -Generate and send report in one-click
Triaxial Frequency Domain Vibration Analysis
-Real-Time Live triaxial Spectrum Plot -Change data acquisition parameters: sampling rate, number samples, windowing, filters, etc -Automatic high peak cursors, CPM cursors, differential calculations for frequency and amplitude -Automatic and adjustable Sidebands for bearing and gear fault detection
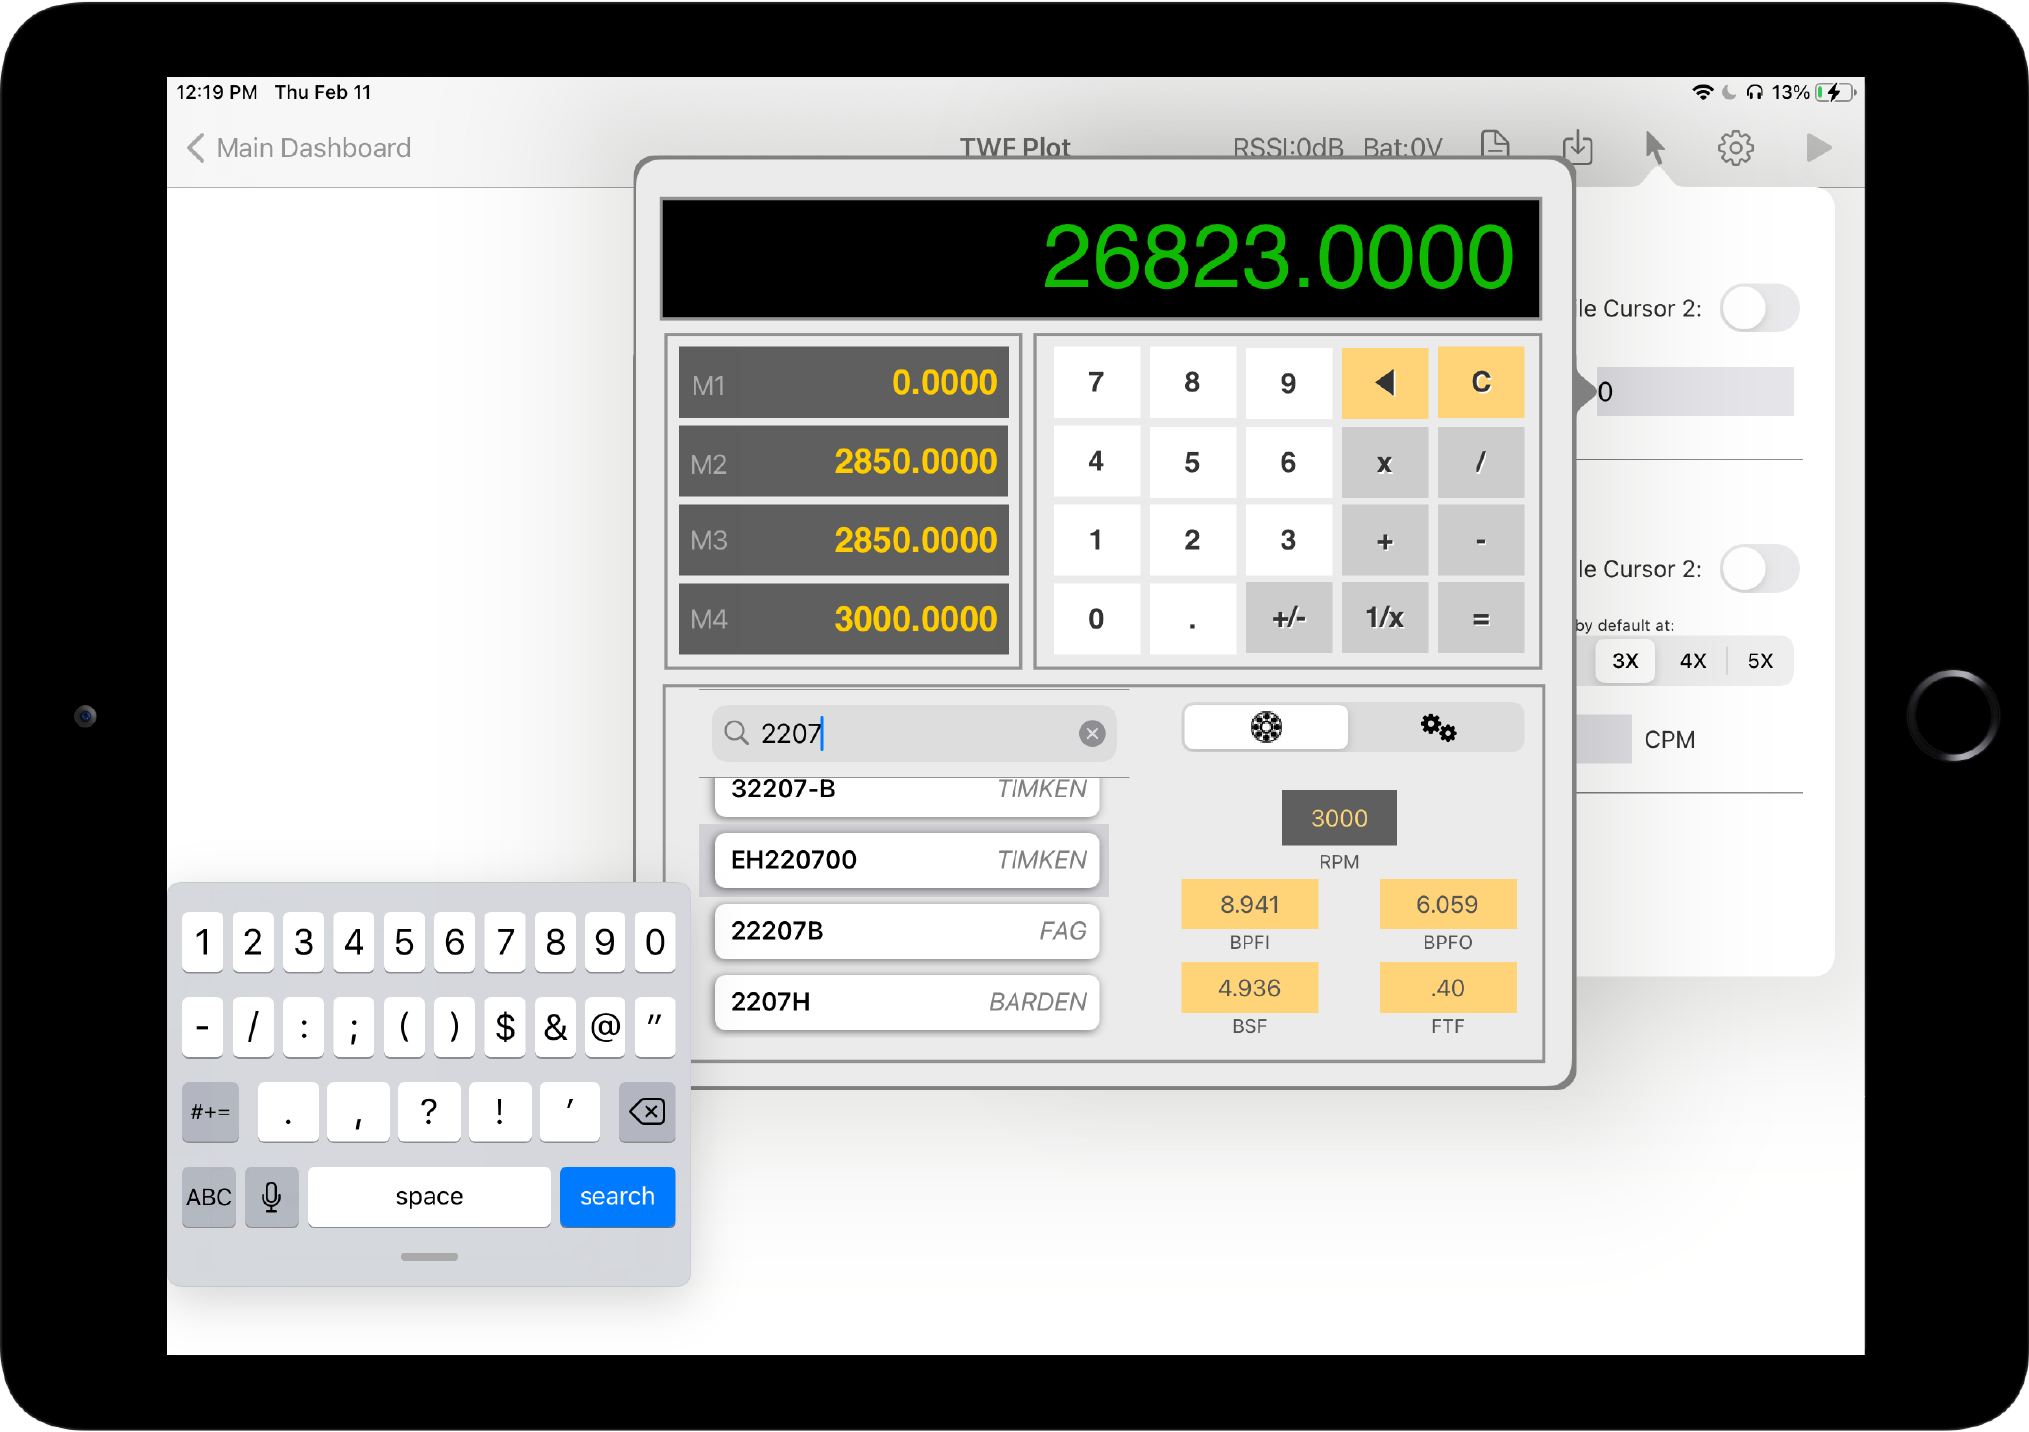
-Fault Frequency and CPM Calculator will place the cursors and sidebands automatically -Scroll or Search from a database of +3k bearing models
Combined Time-Waveform and Spectrum Analysis
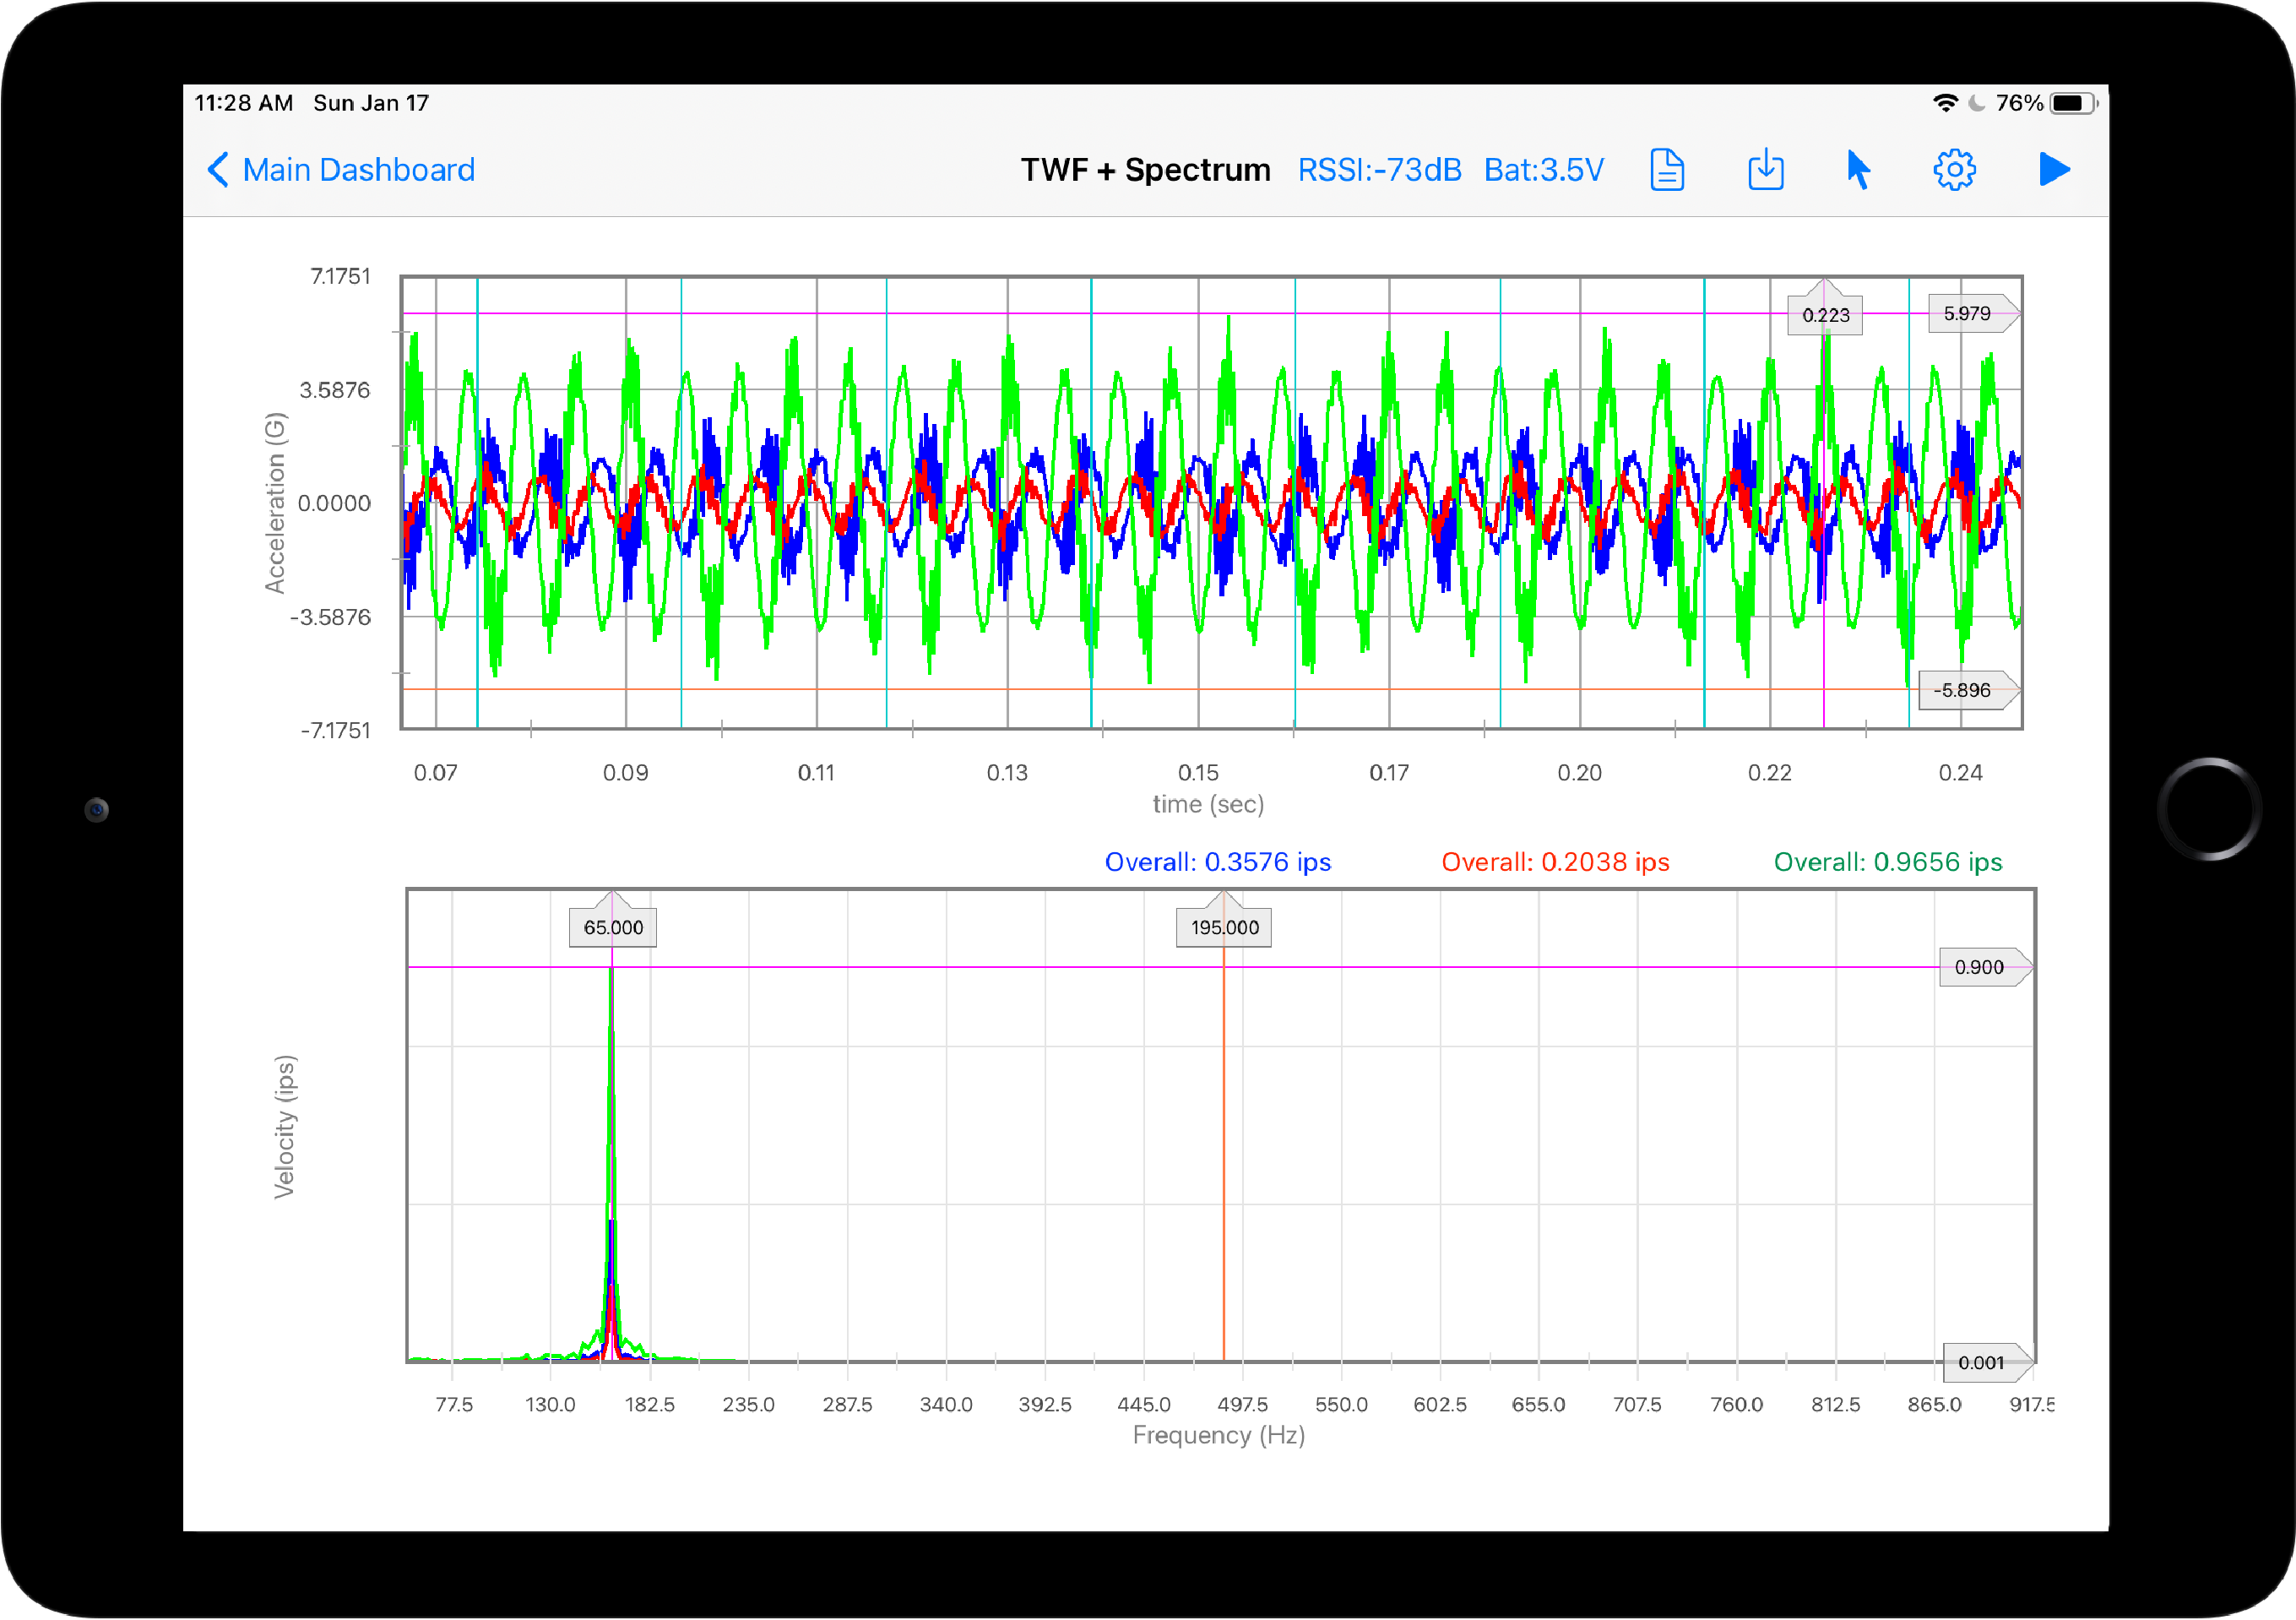
-Real-Time Live triaxial TWF and FFT -Add cursors to compare in both plots
Spectrum Difference Analysis
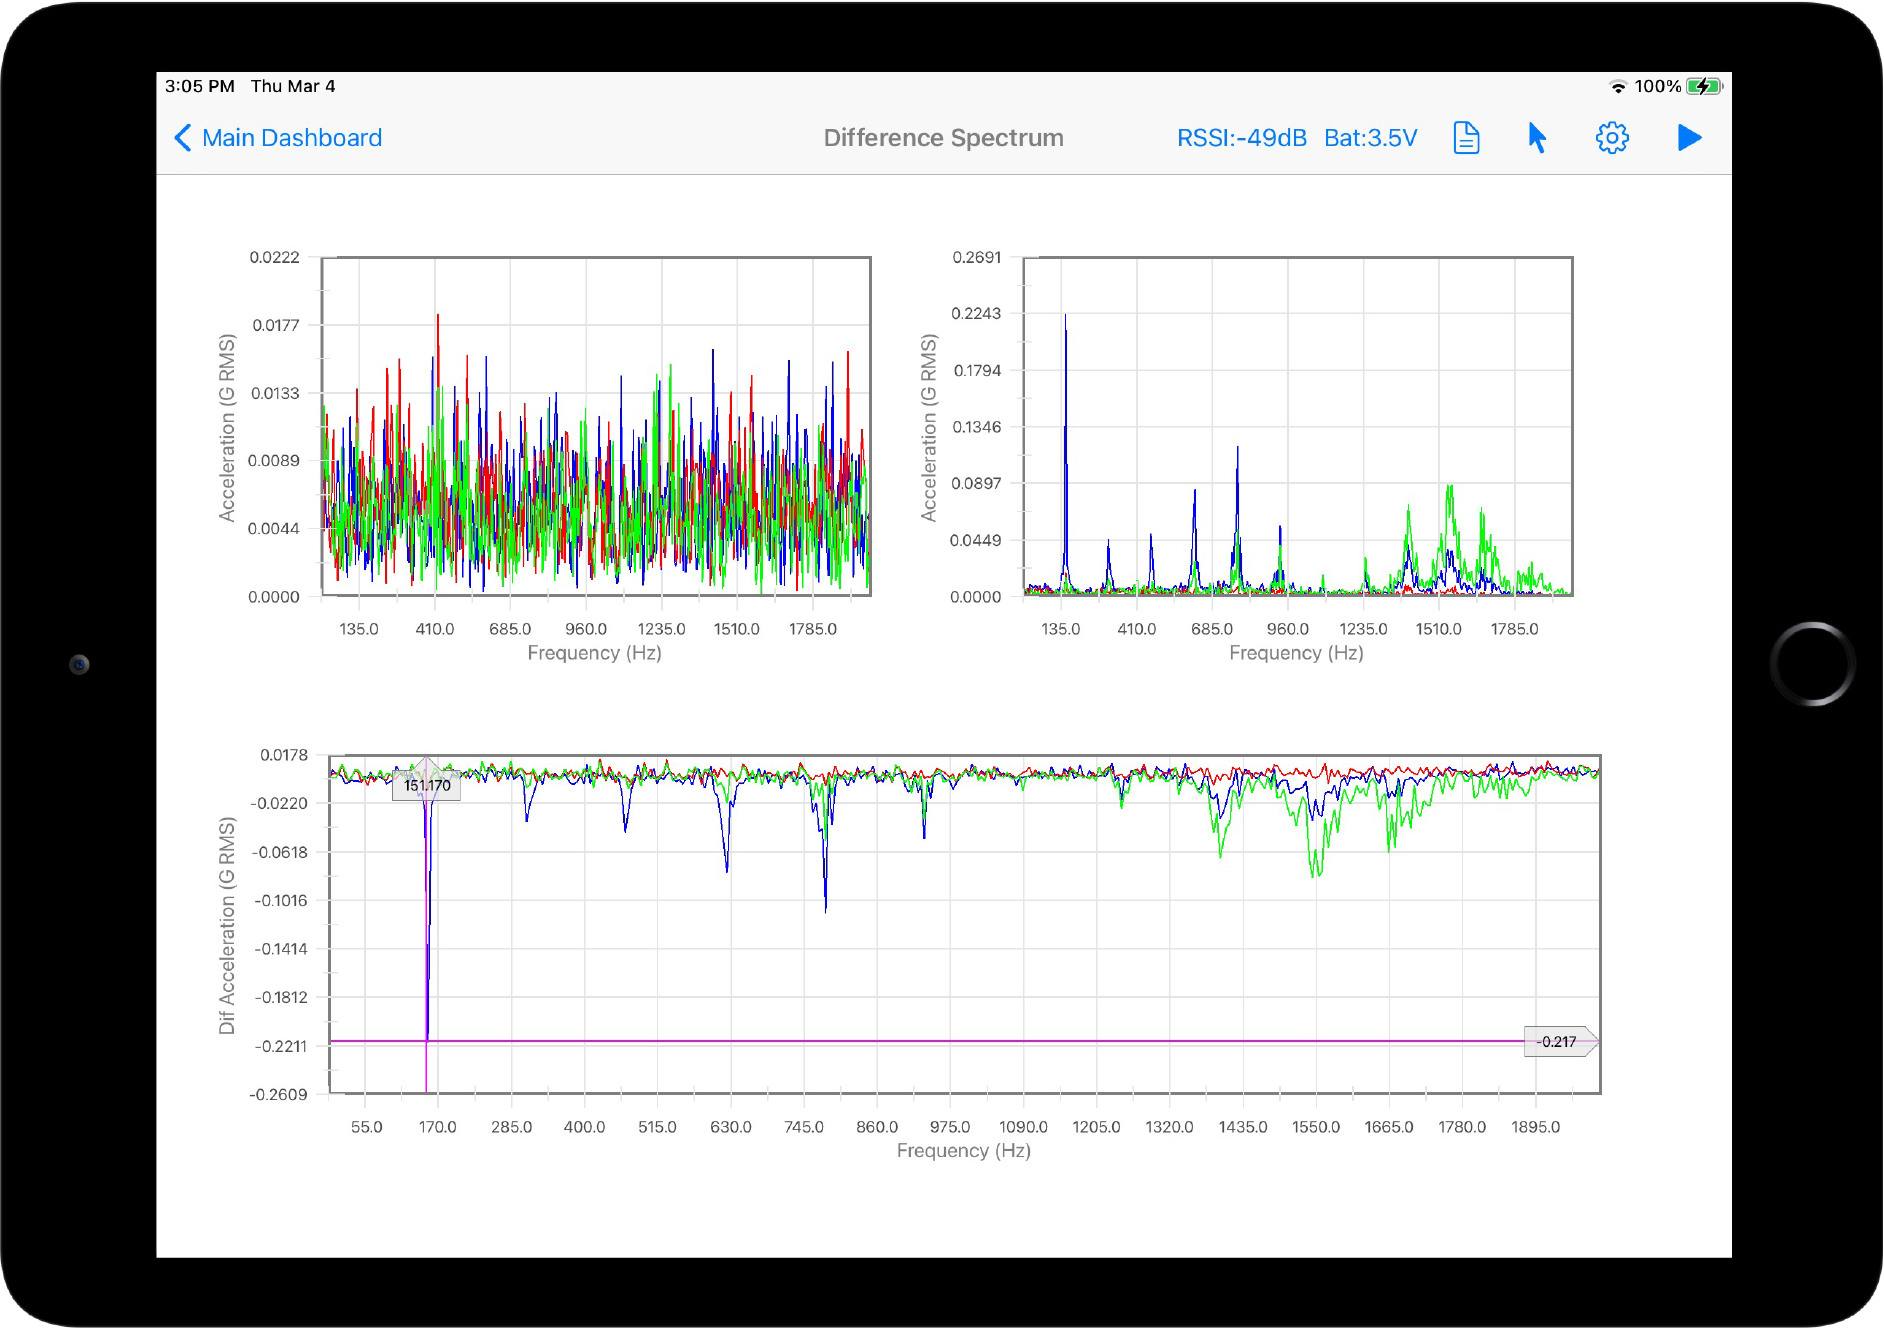
-Compare spectra from two points or measurements and find the difference spectrum -Compare single axis spectra and up to 3 axes spectra
Live Waterfall Plot
-Compare real-time live spectra -Set manual measurements or automatic data collection
Coast-Down / Ramp-Up Test
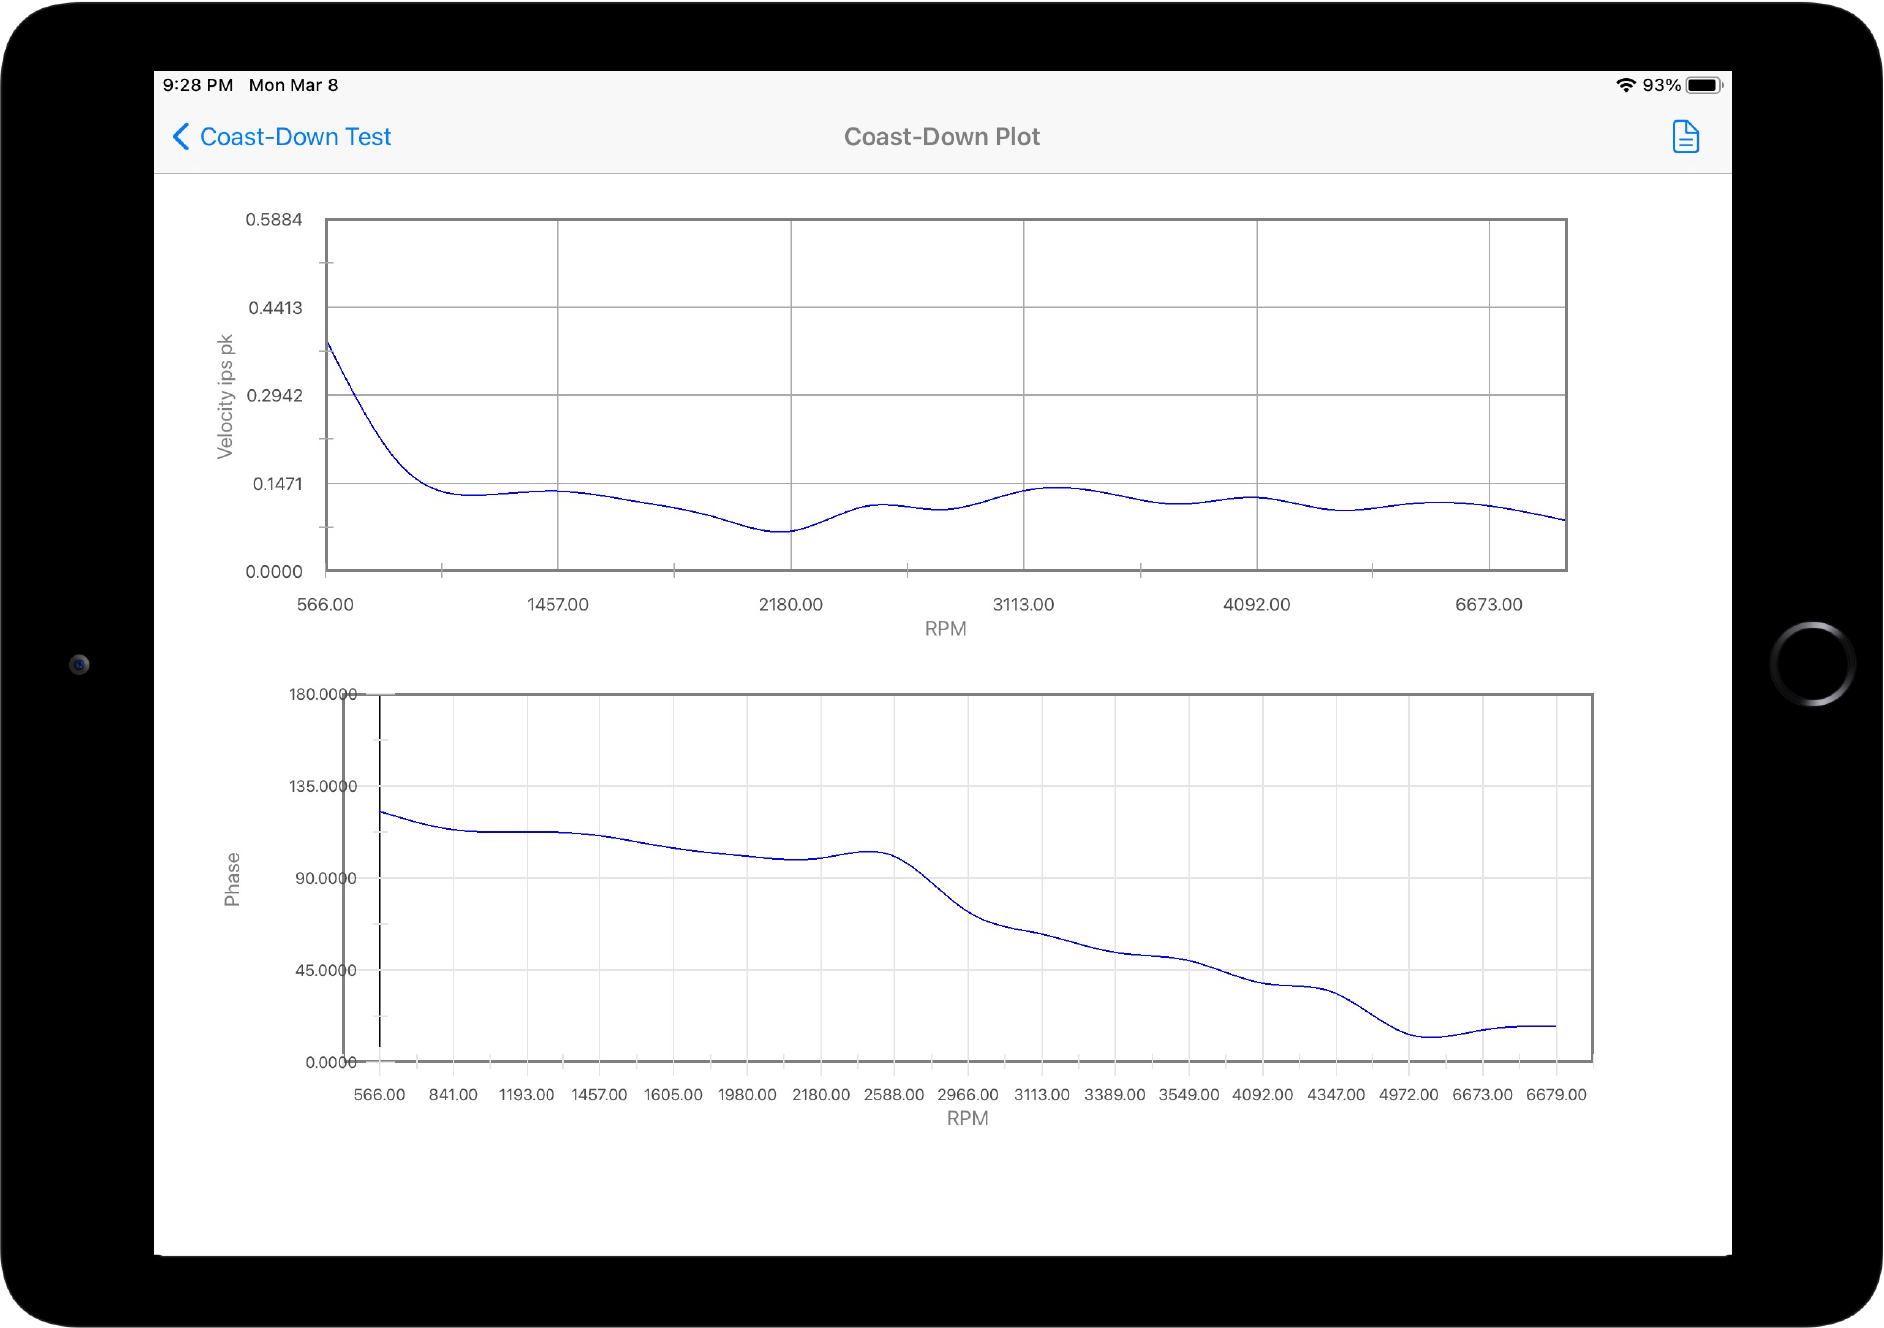
-Plot Filtered and Unfiltered Vibration Amplitude and Phase vs RPM
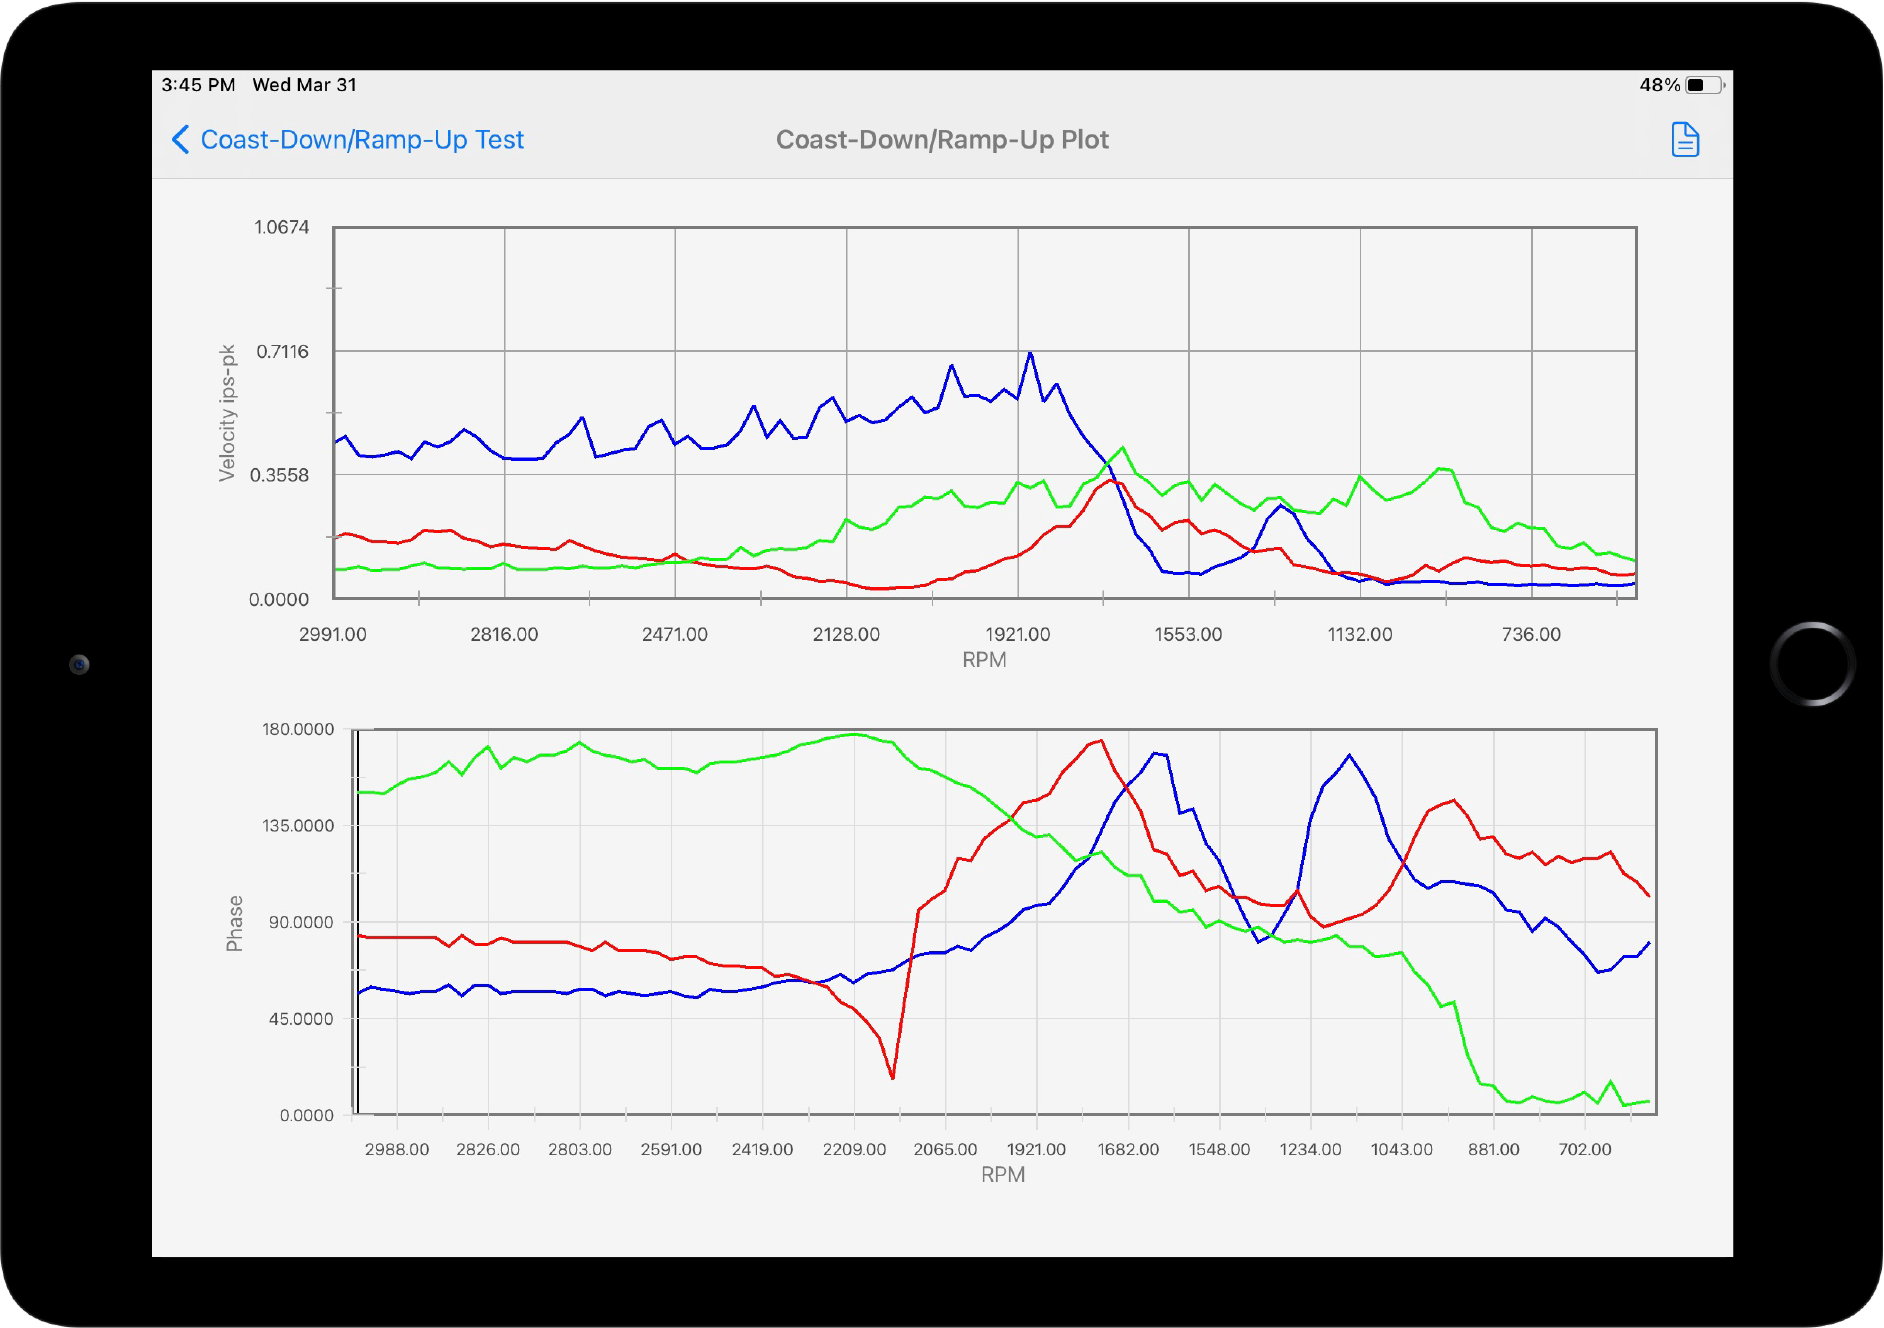
-Plot Filtered and Unfiltered Vibration Amplitude and Phase vs RPM - Up to 4-channel sensors to plot the triaxial amplitude and phase bode plot
Bump-Test Analysis
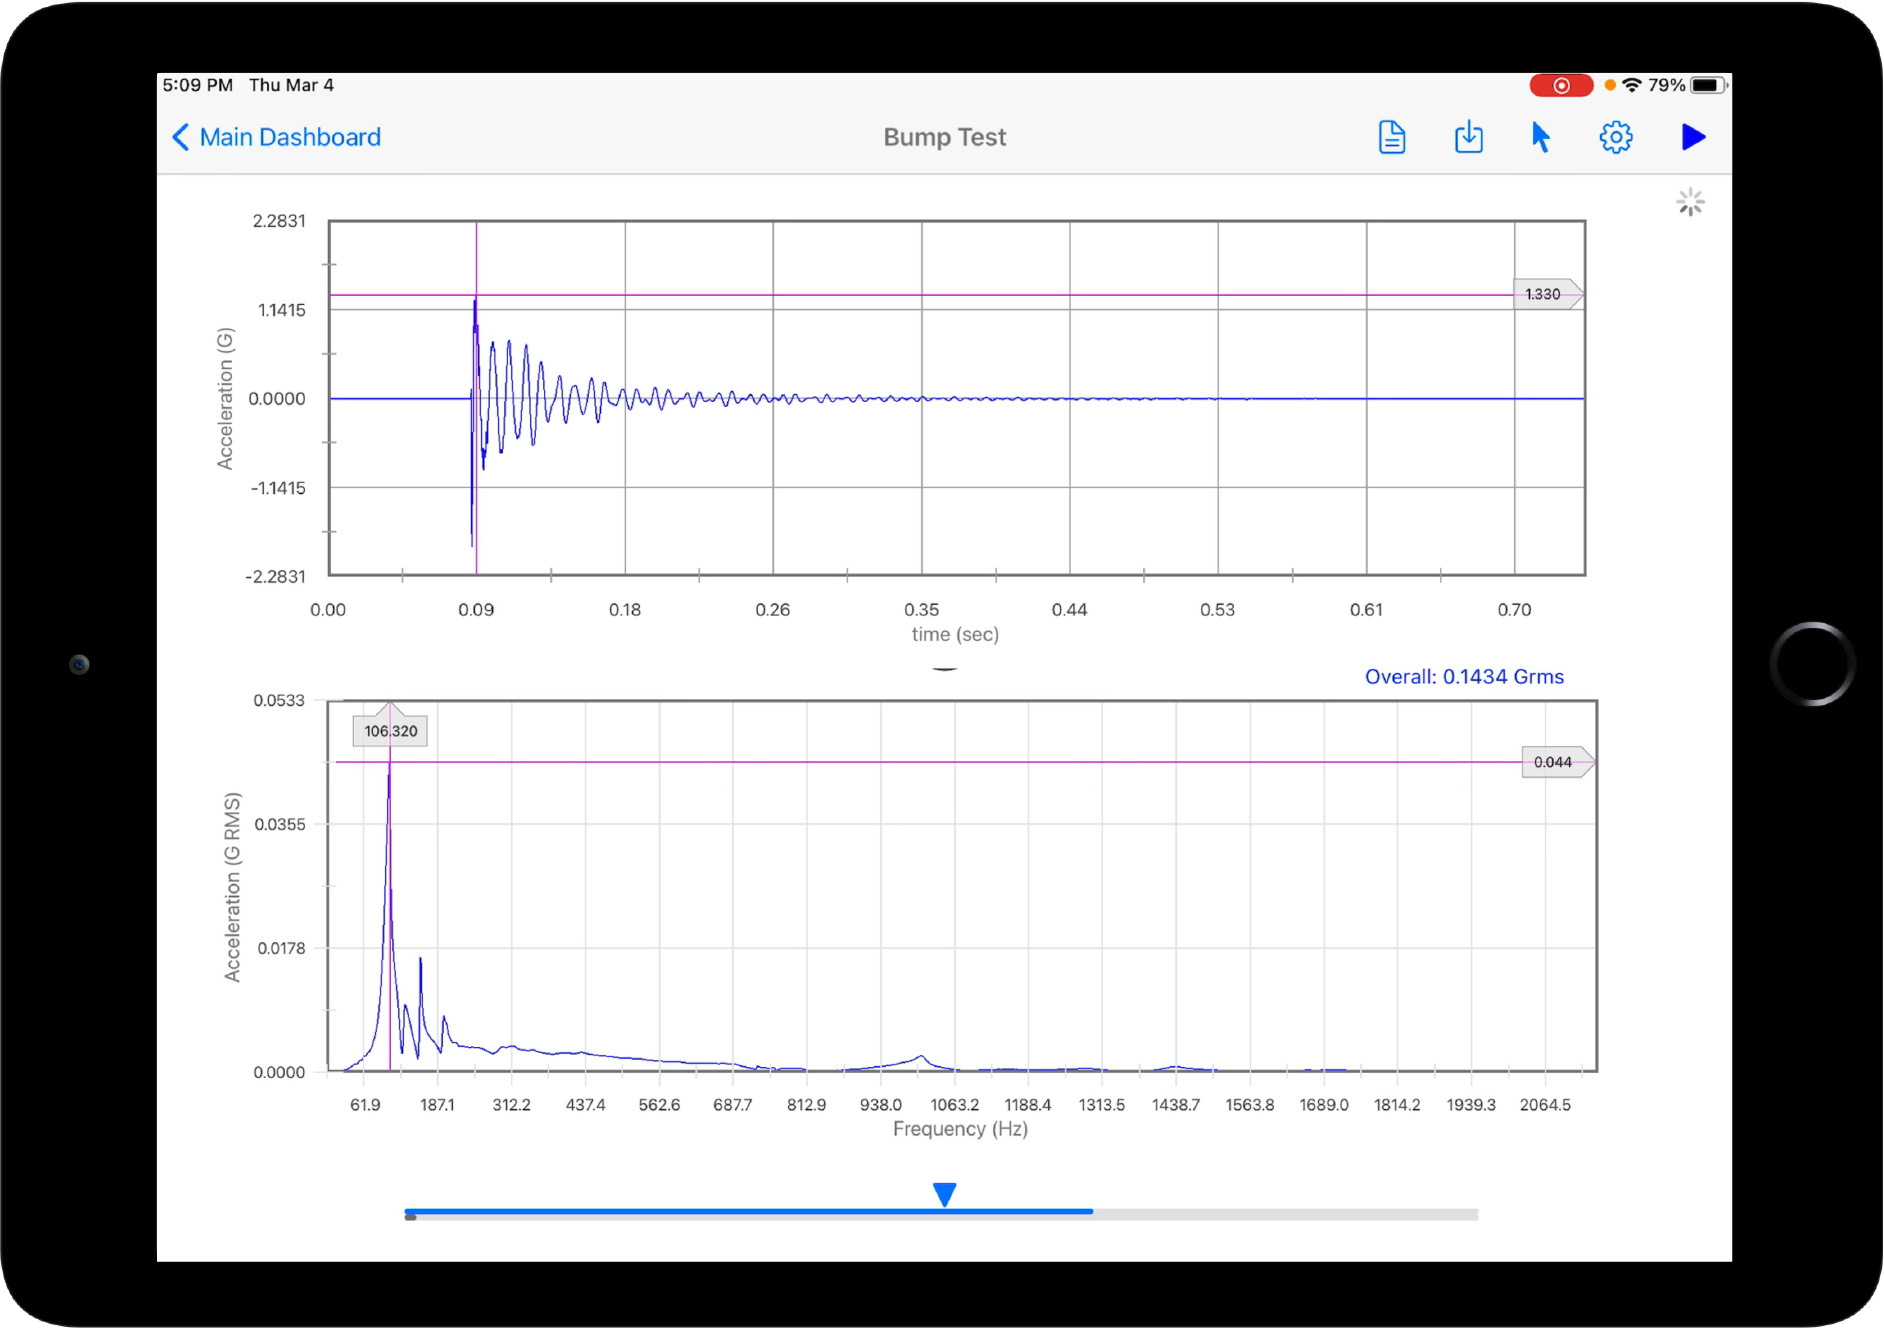
-Use impact-hammer to trigger the measurement -Adjust impact force and view impact in real-time force scale -Triaxial response when using the 4-channel wireless sensor
Vibration Orbit
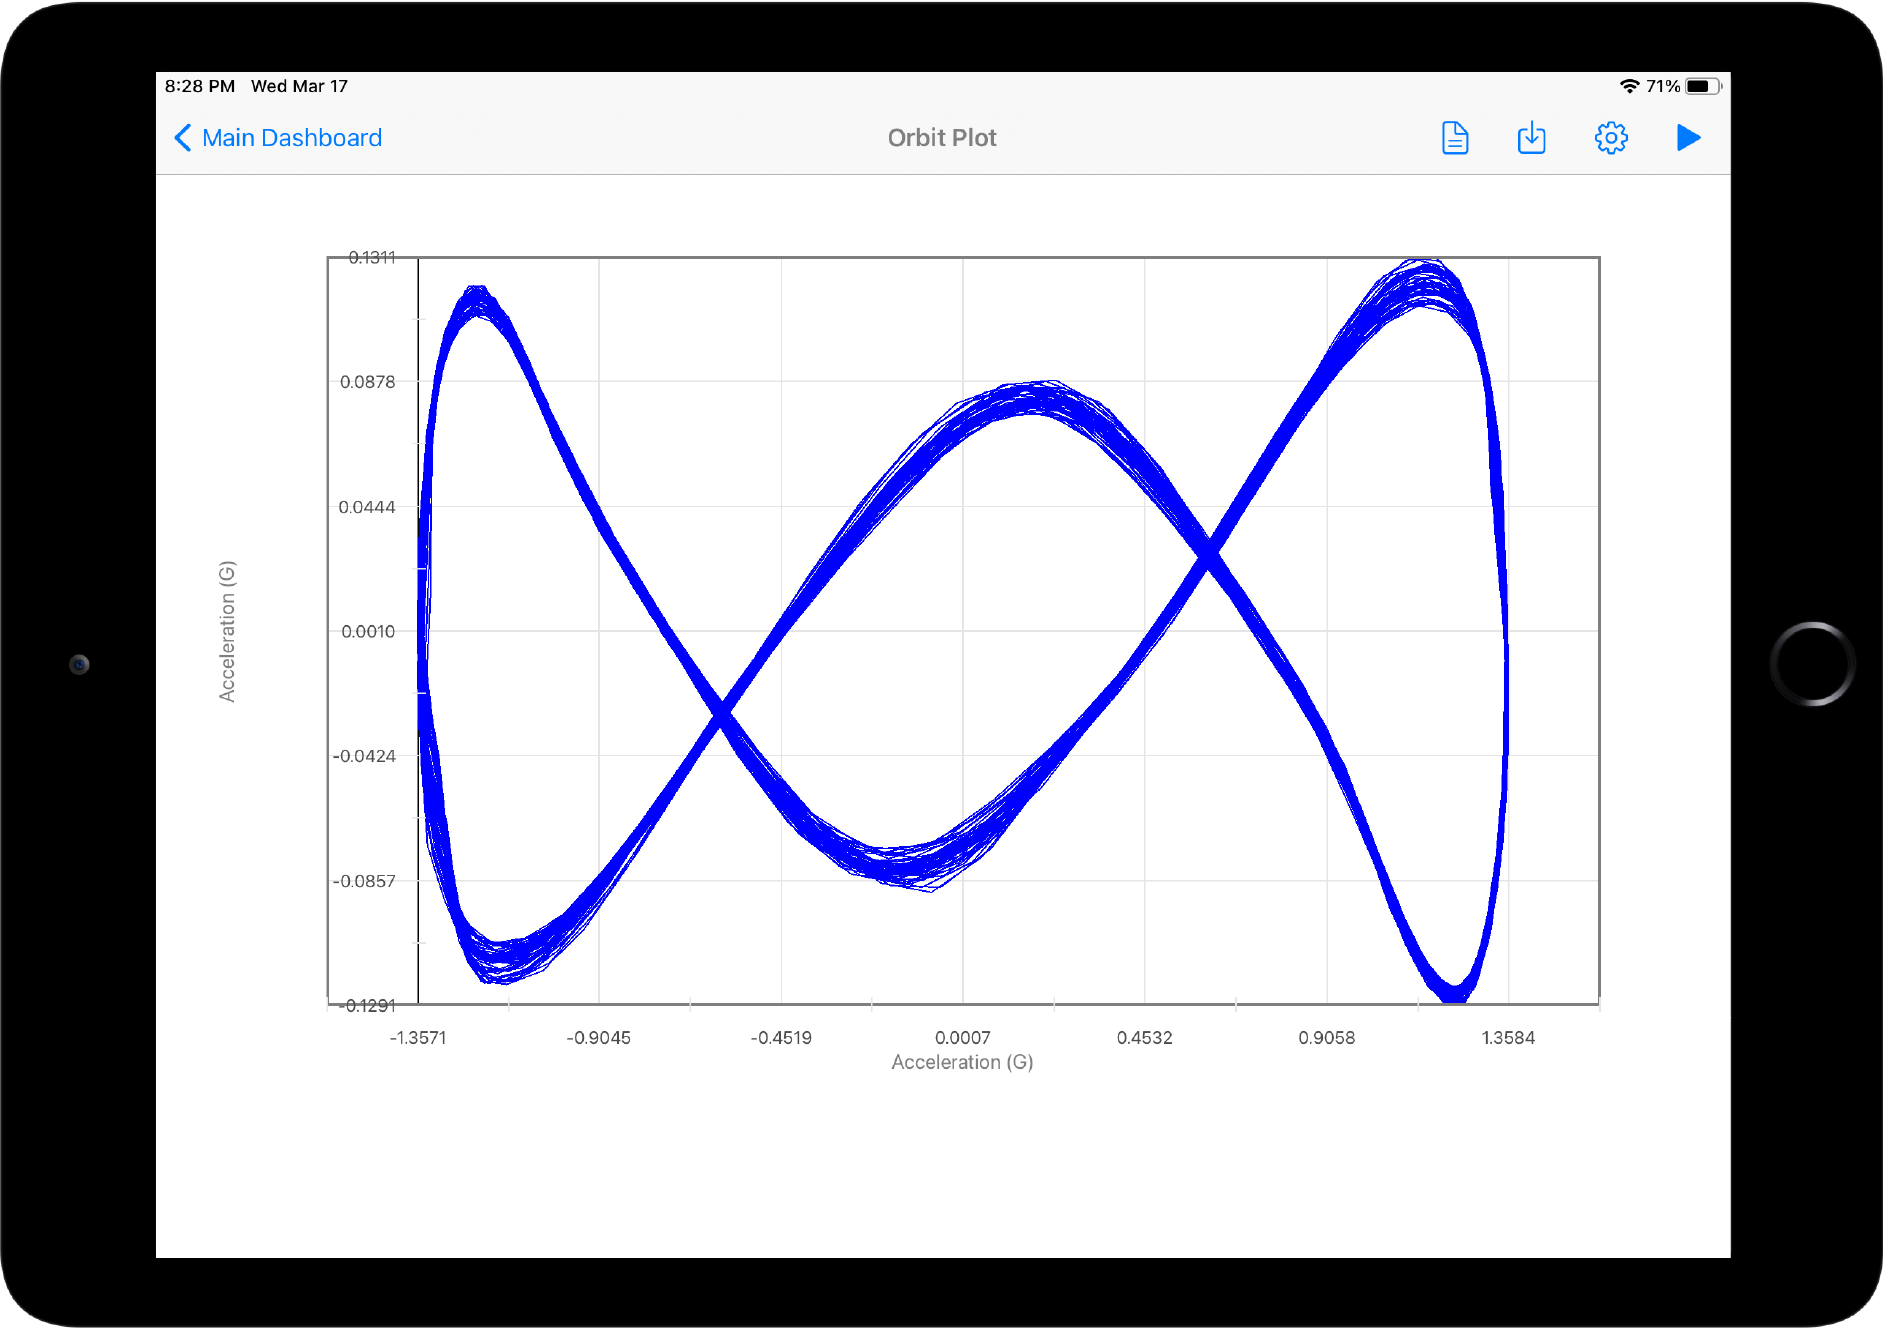
-Real-time 2-Axis orbit -Generate and send report in one-click
Transmissibility Spectrum
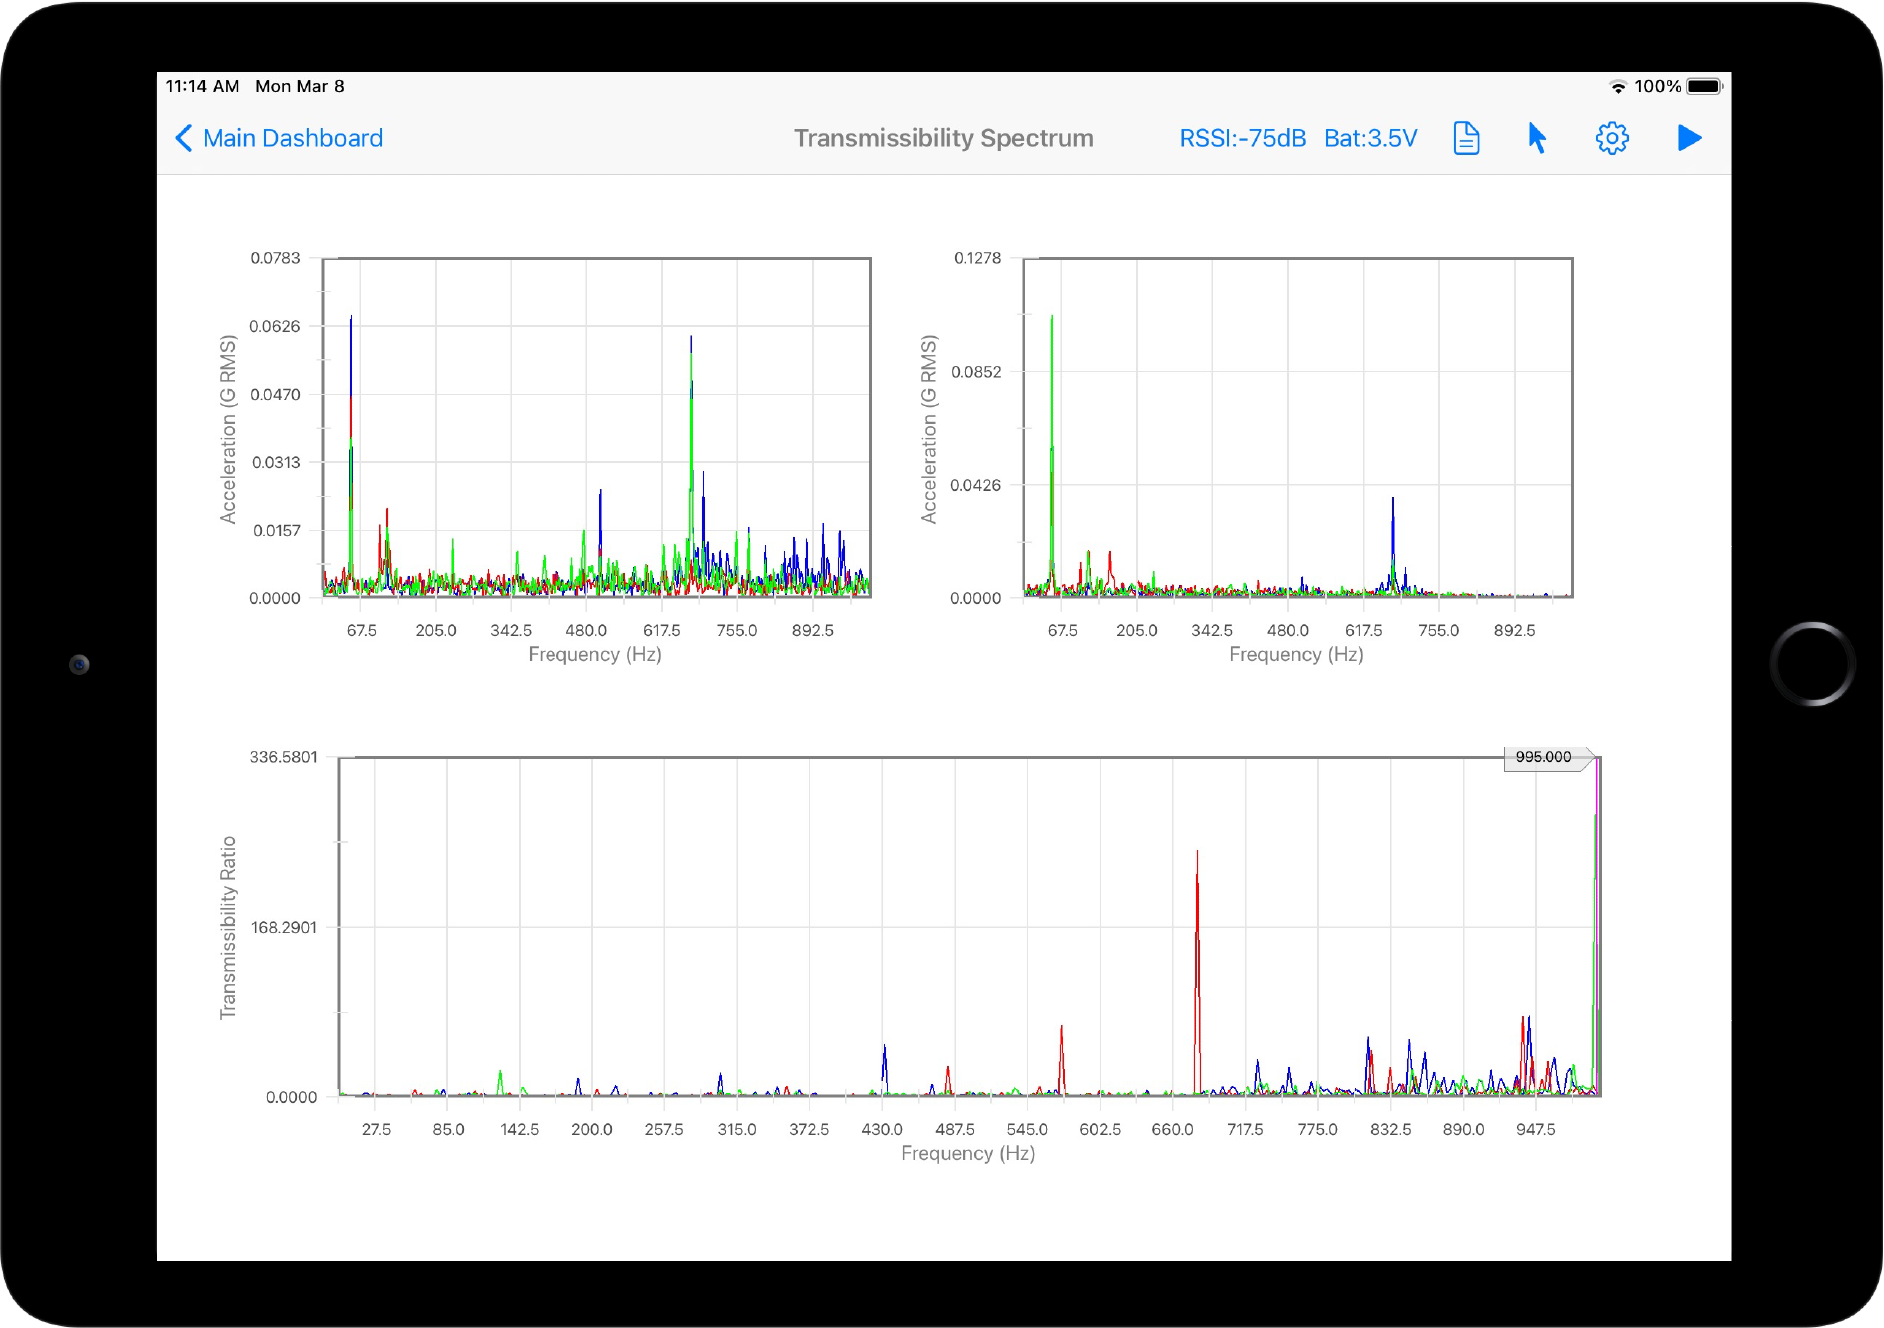
-Compare Vibration Spectra for 2 points and plot the transmissibility between them -One to Three Axes transmissibility -Useful for checking vibration transmissibilty from the machine to the base, or from one machine to another
Vibration Logger
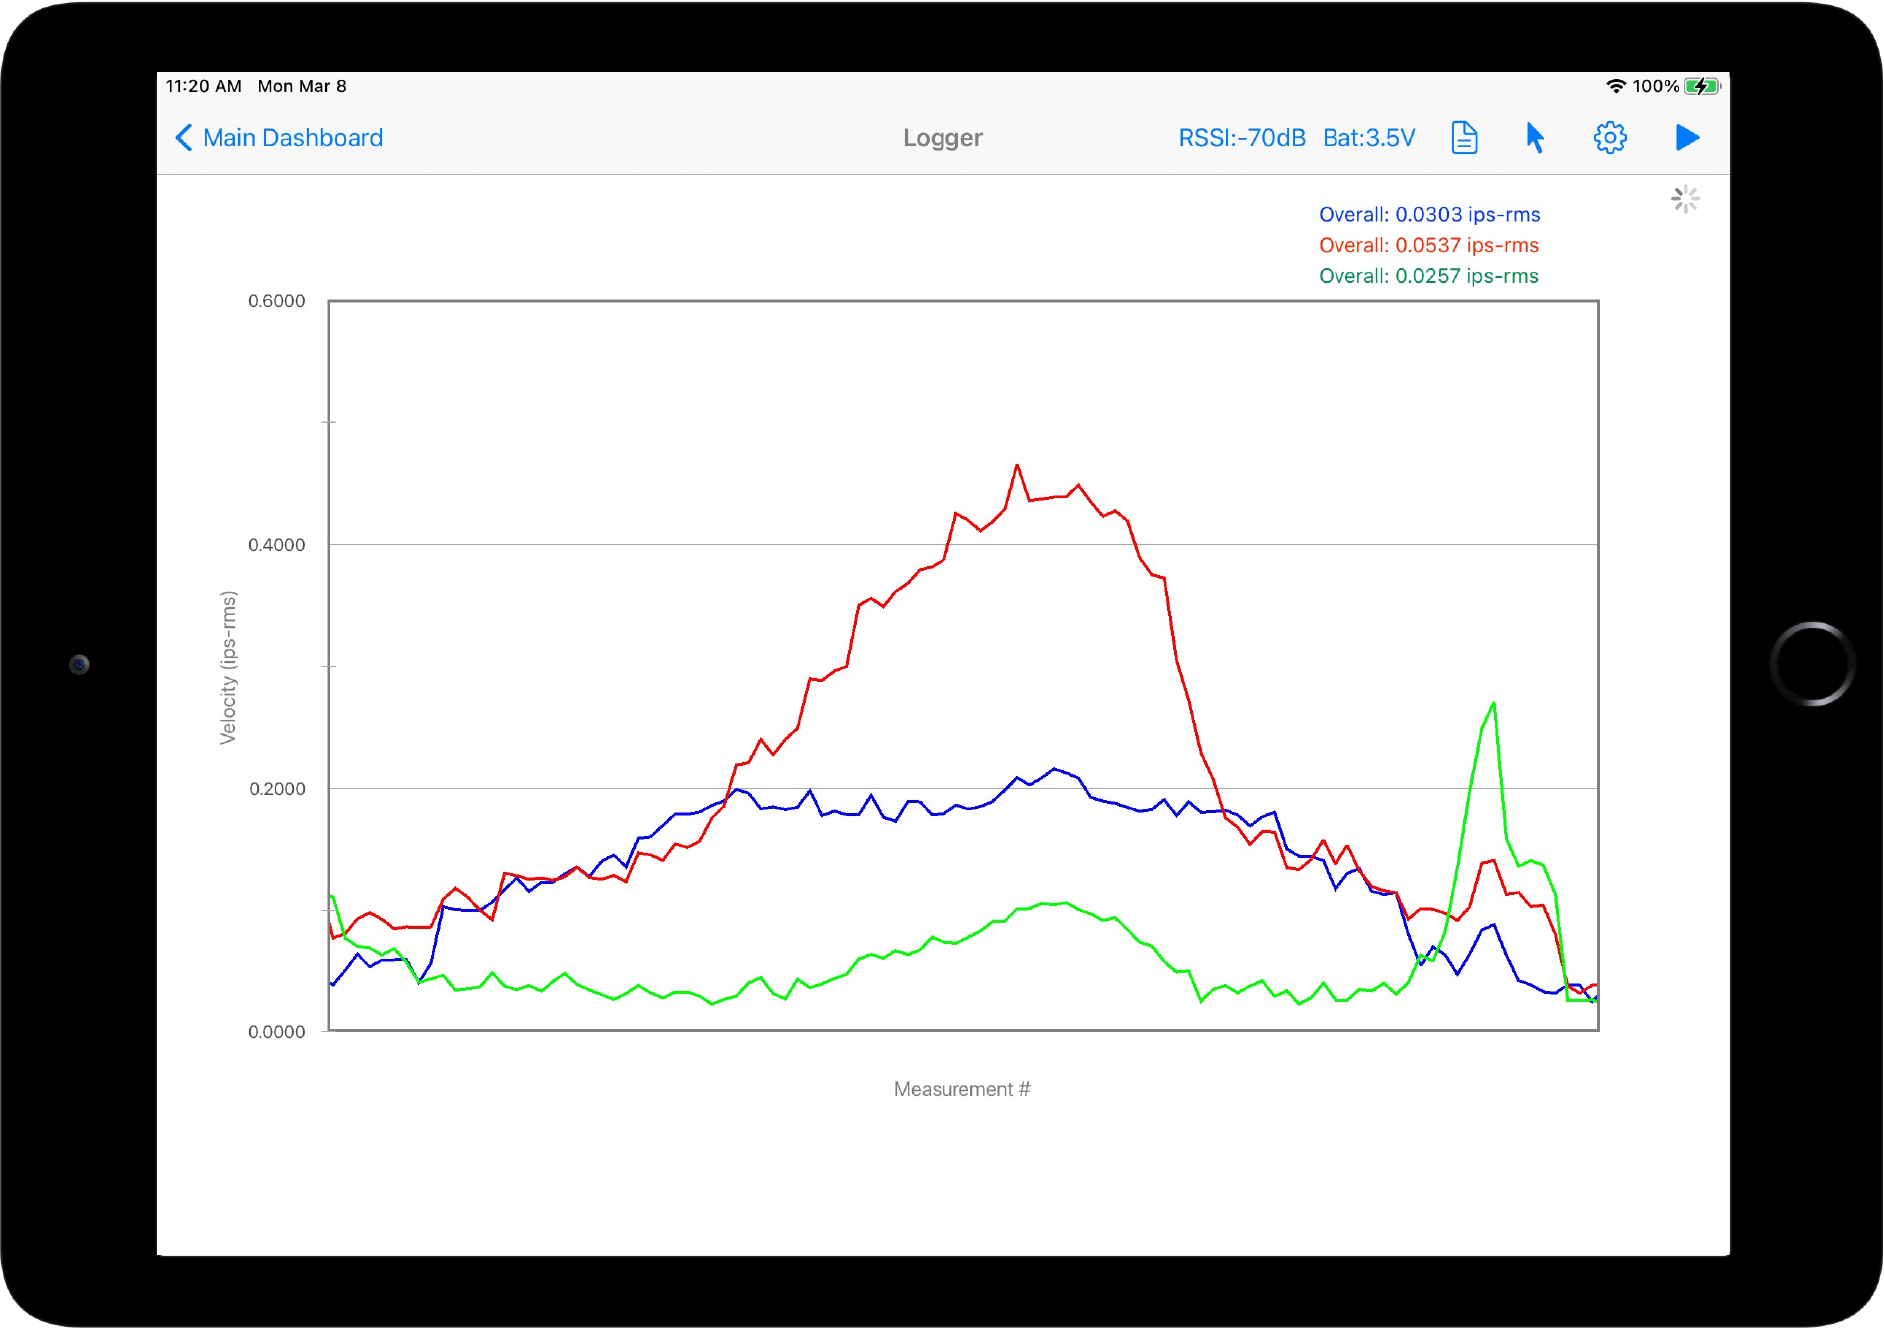
-Plot Vibration Overall (Acceleration or Velocity) vs time -Up to 3-Axis simultaneously -Autoscroll plot
Polar Time-Waveform
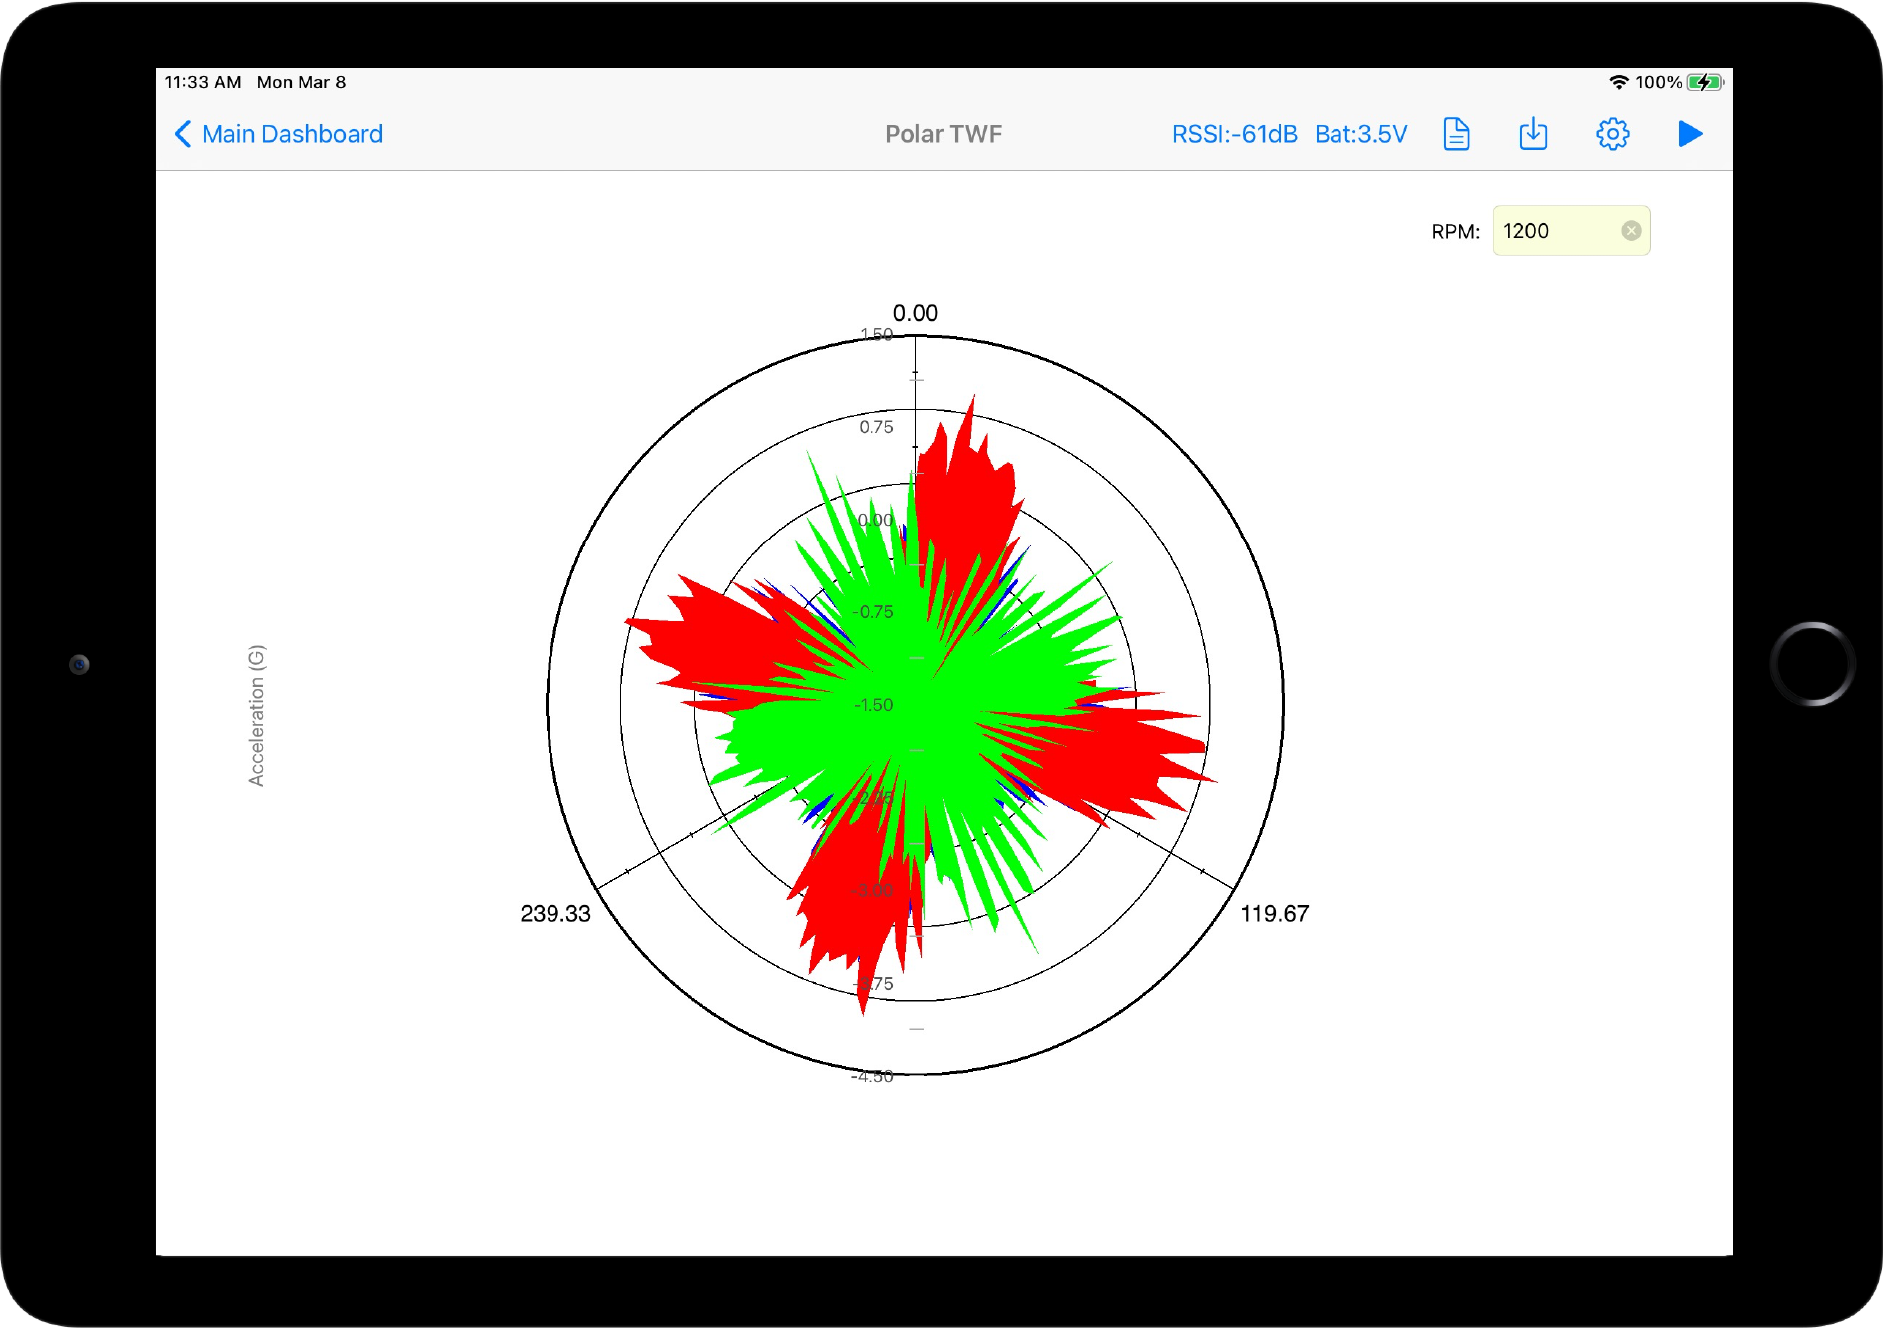
-Special for Gear and Fan/Pumps Fault Analysis -Up to 3-Axis simultaneously -Adjust RPM or Customize CPM
Cross-Spectrum Phase Analysis
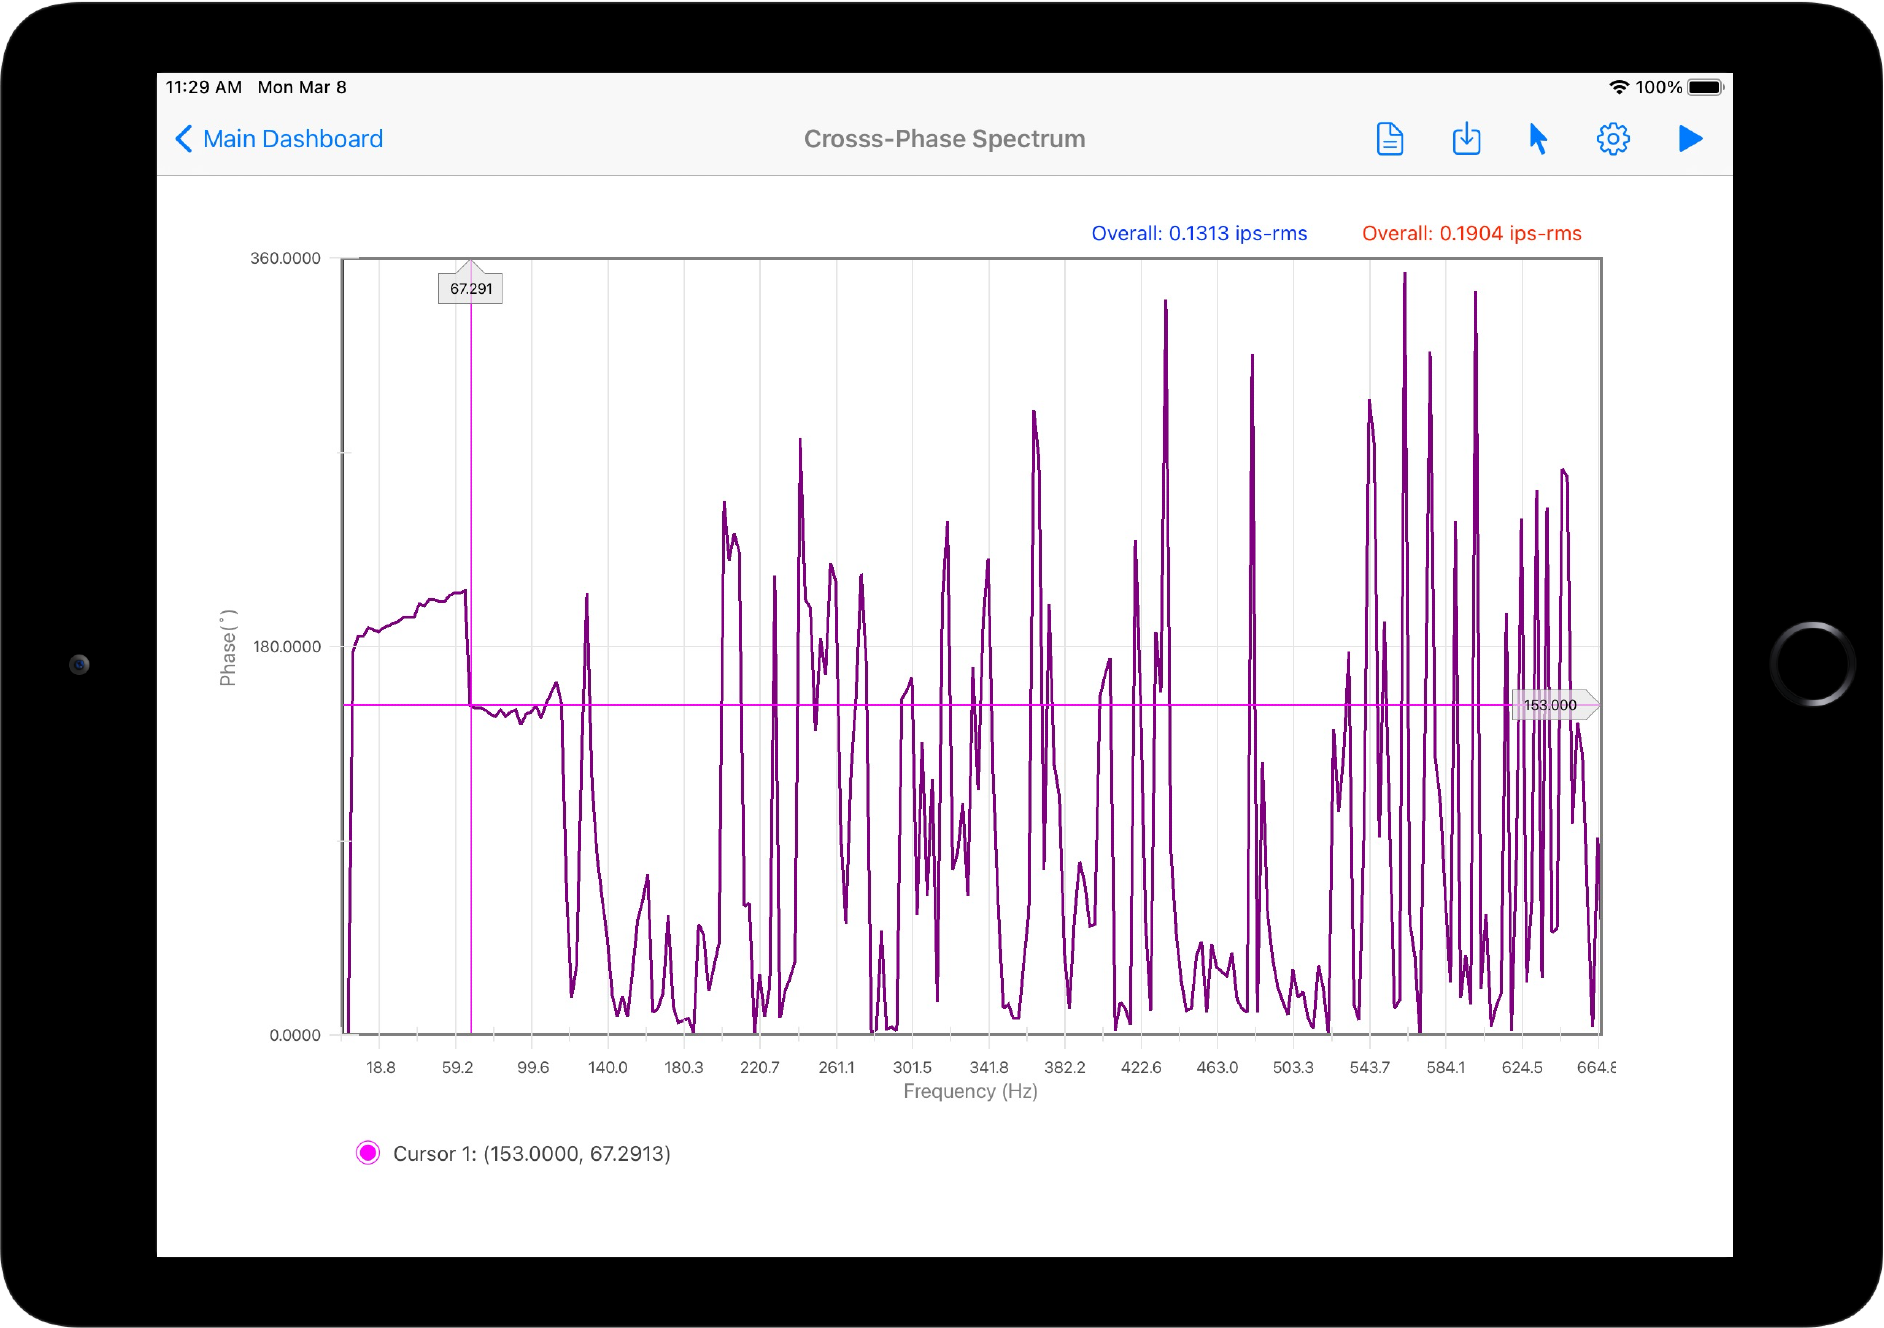
-Plot the Cross-Spectrum Phase between two measurement points -Phase and Frequency cursors
Phase and Amplitude Spectra
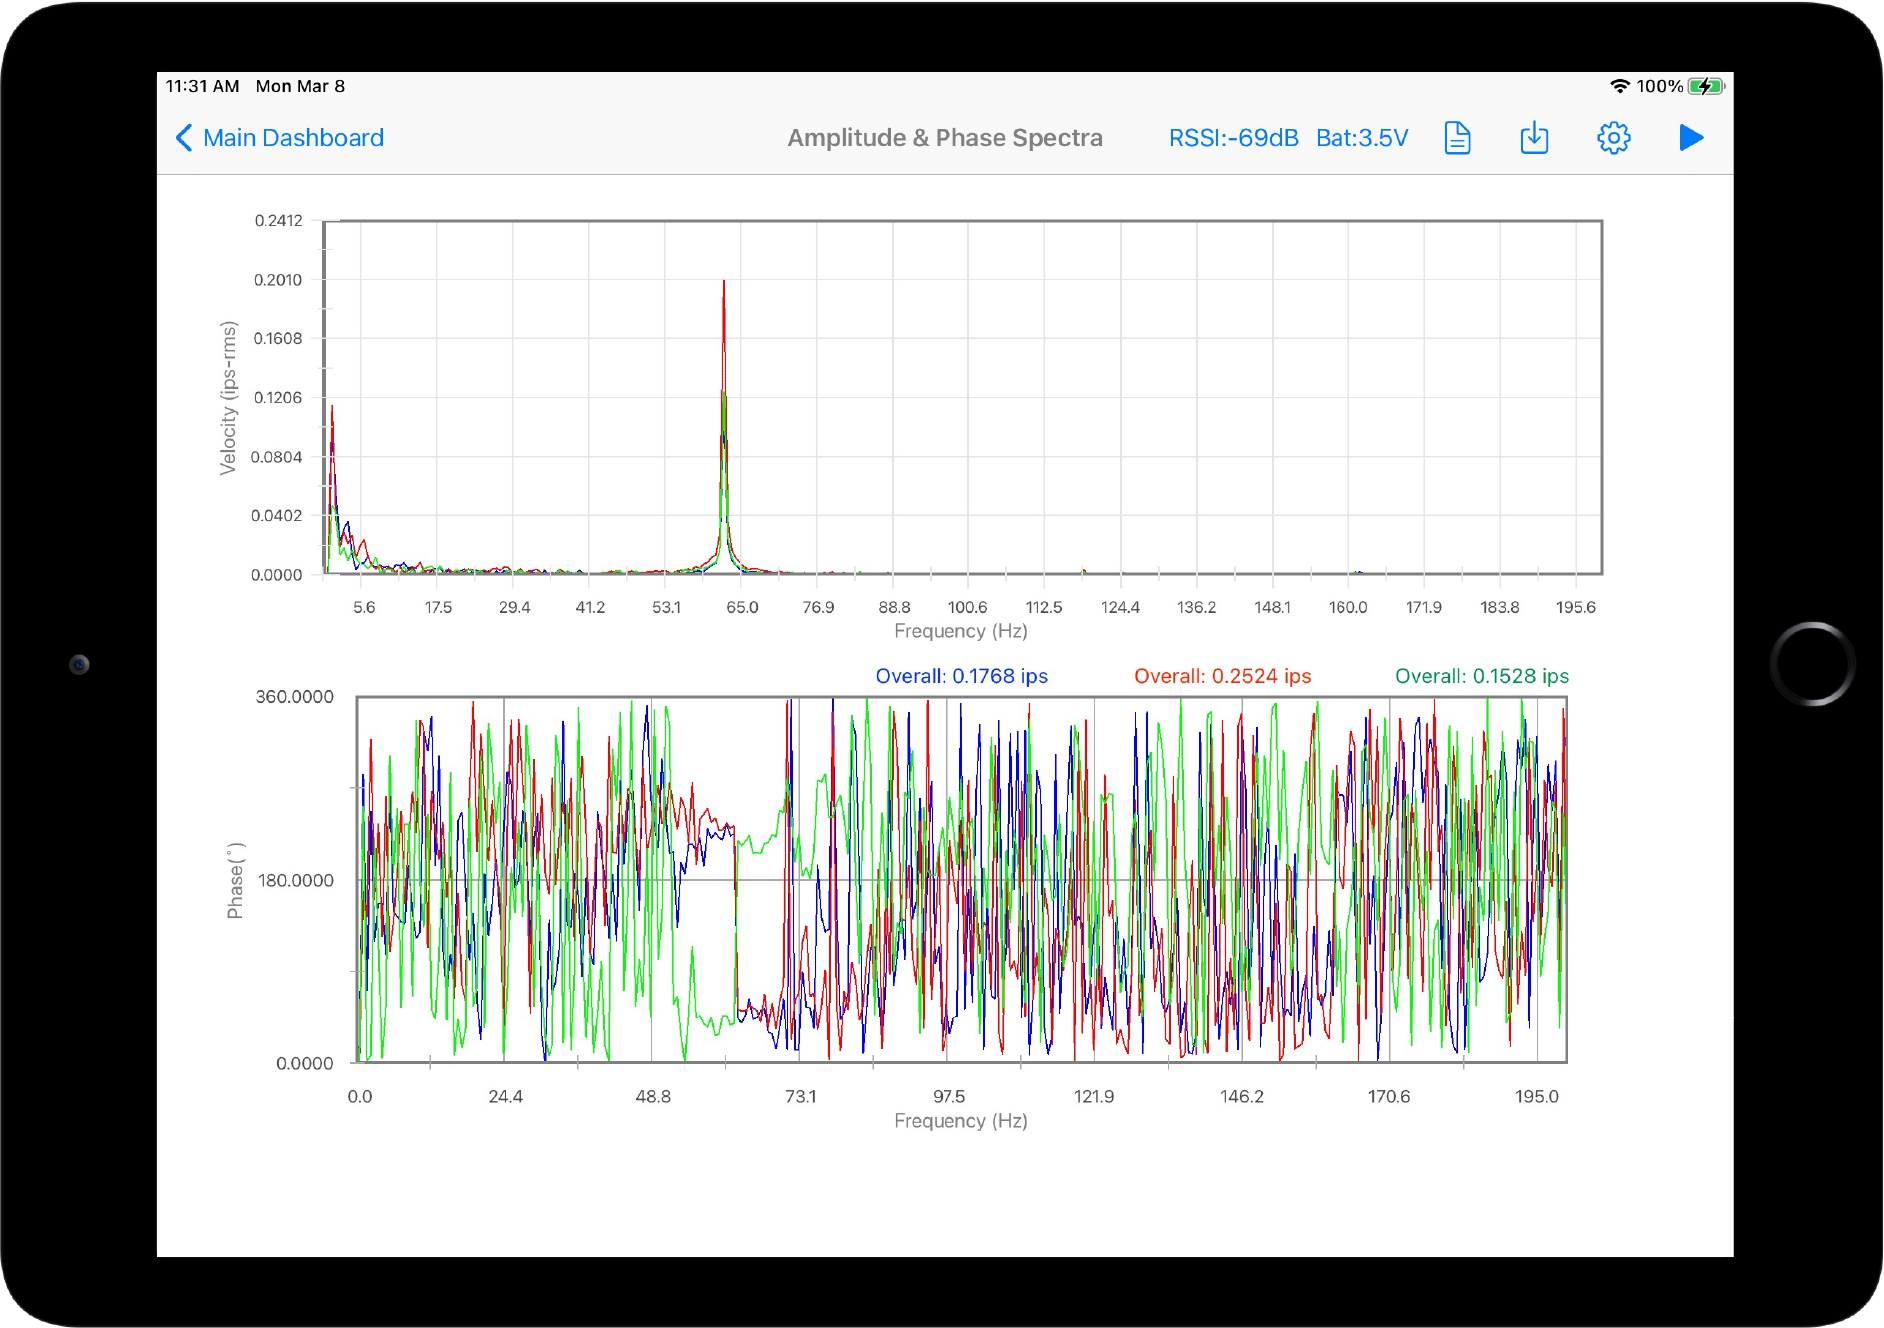
-Plot the Absolute Phase Spectrum and compare with the Amplitude Spectrum
Machine Certification & Testing
-Measure simultaneous triaxial vibration for each point -The MCD (Machine Condition Detection) module will generate an instantaneous response -Generate Report and synch data and report with the cloud asset tree
Manage File & Data from one place
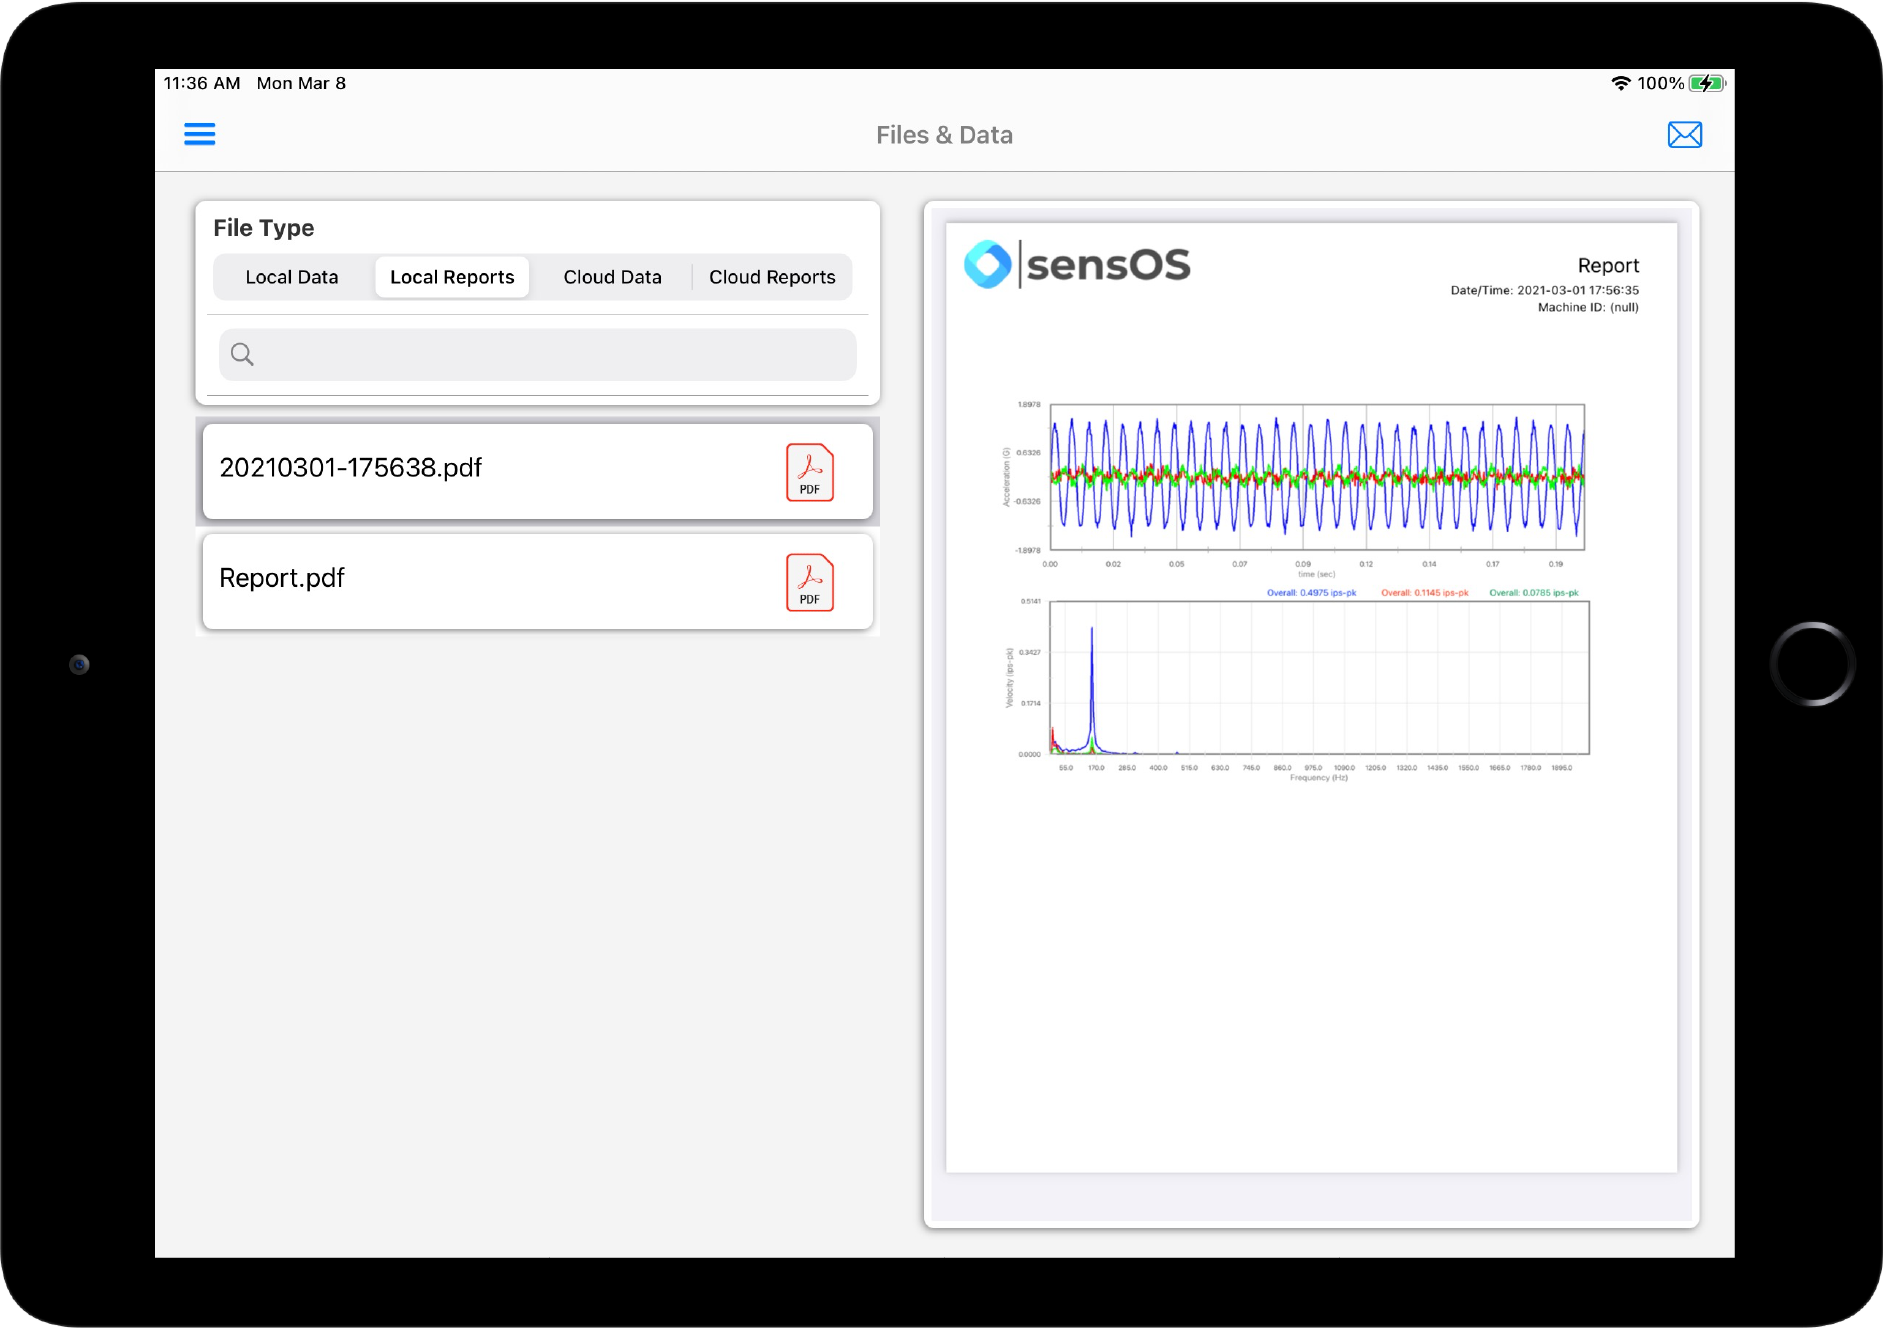
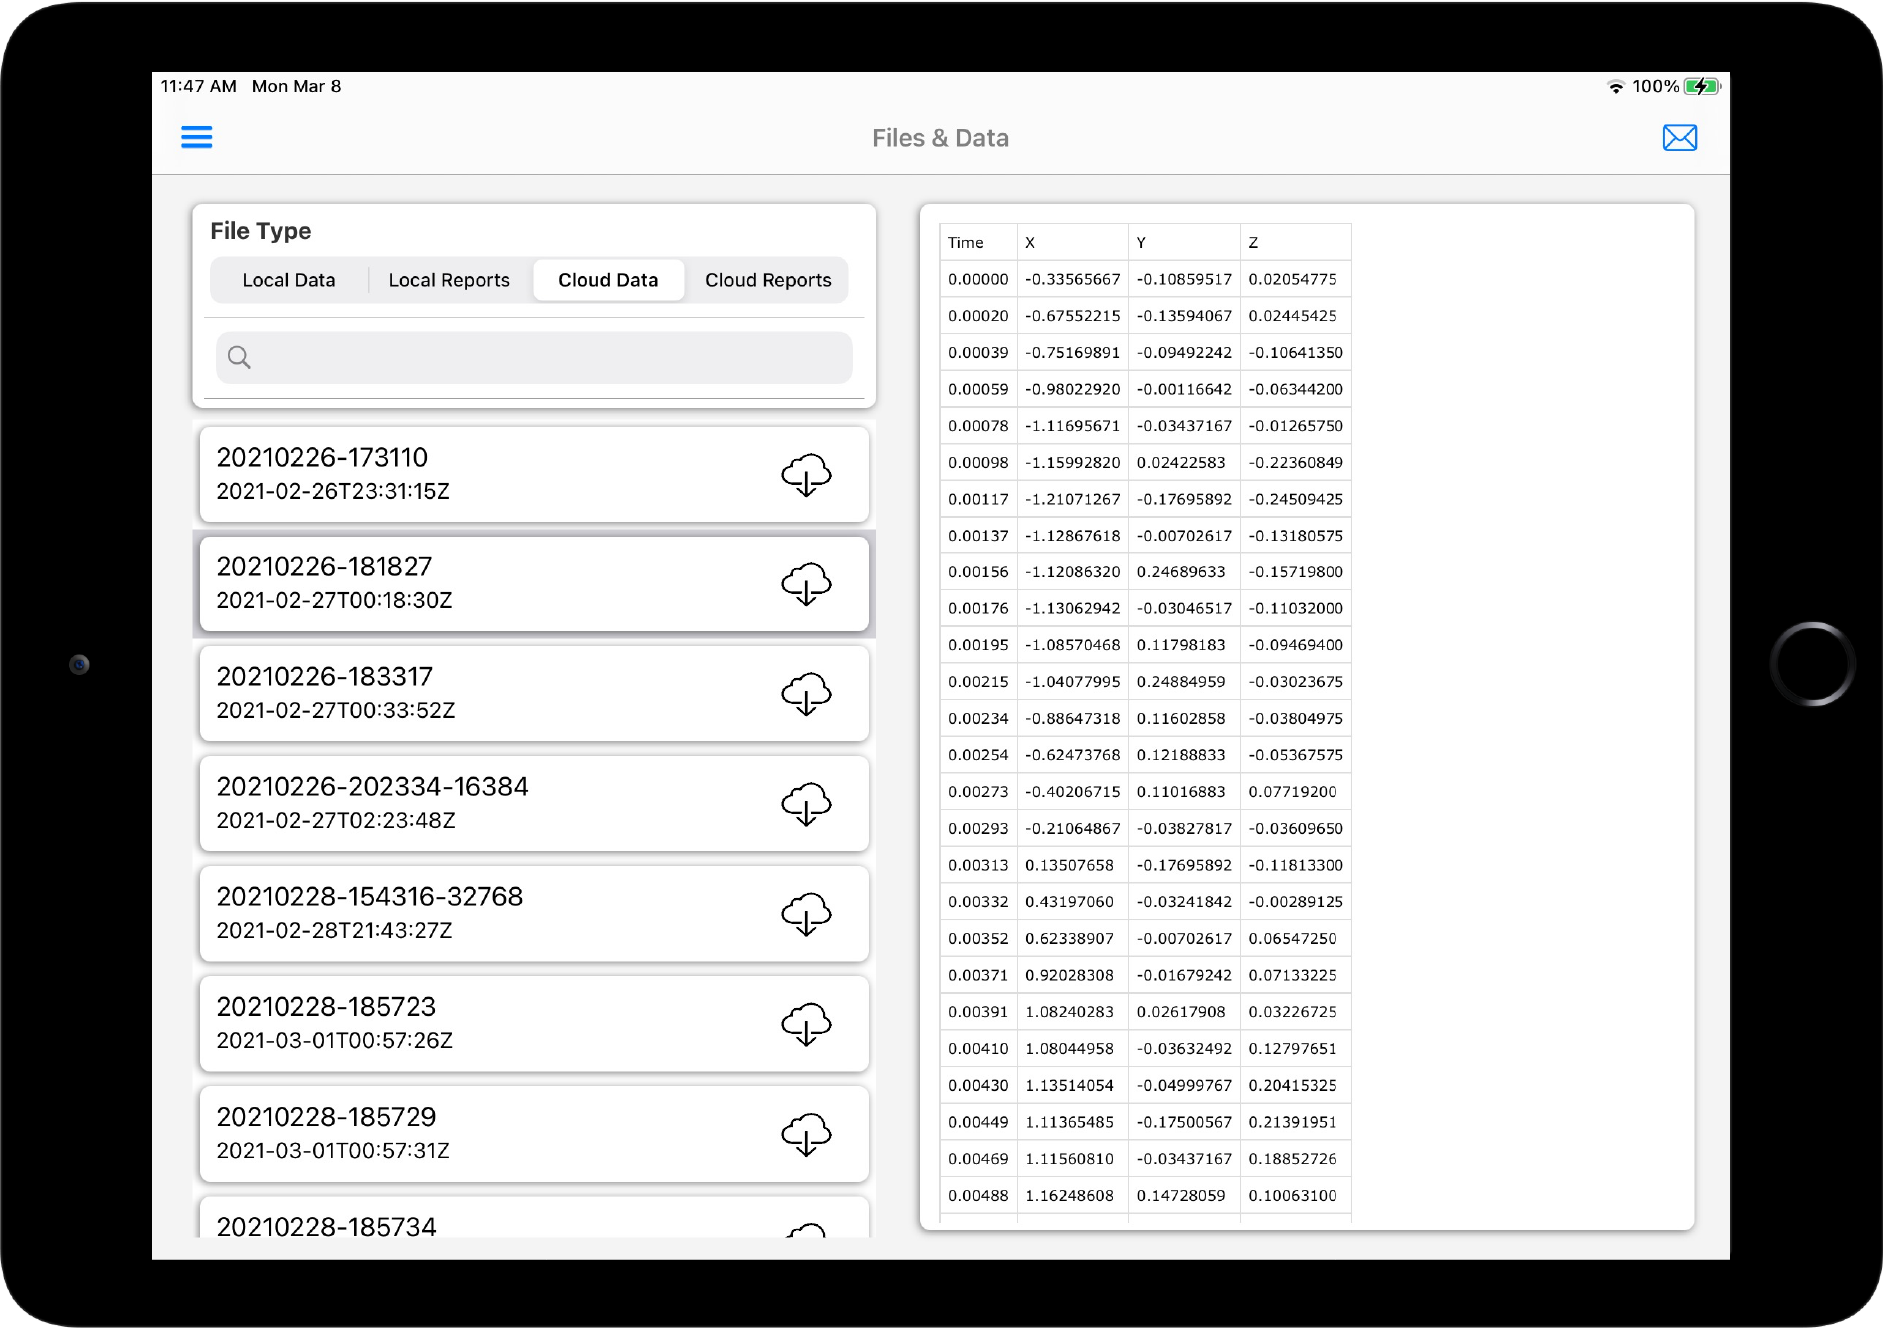
-View stored PDF reports or CSV data -View reports and data stored in the cloud bucket -Email reports or email measurement data in csv format
Upload stored data to the Cloud Asset Tree
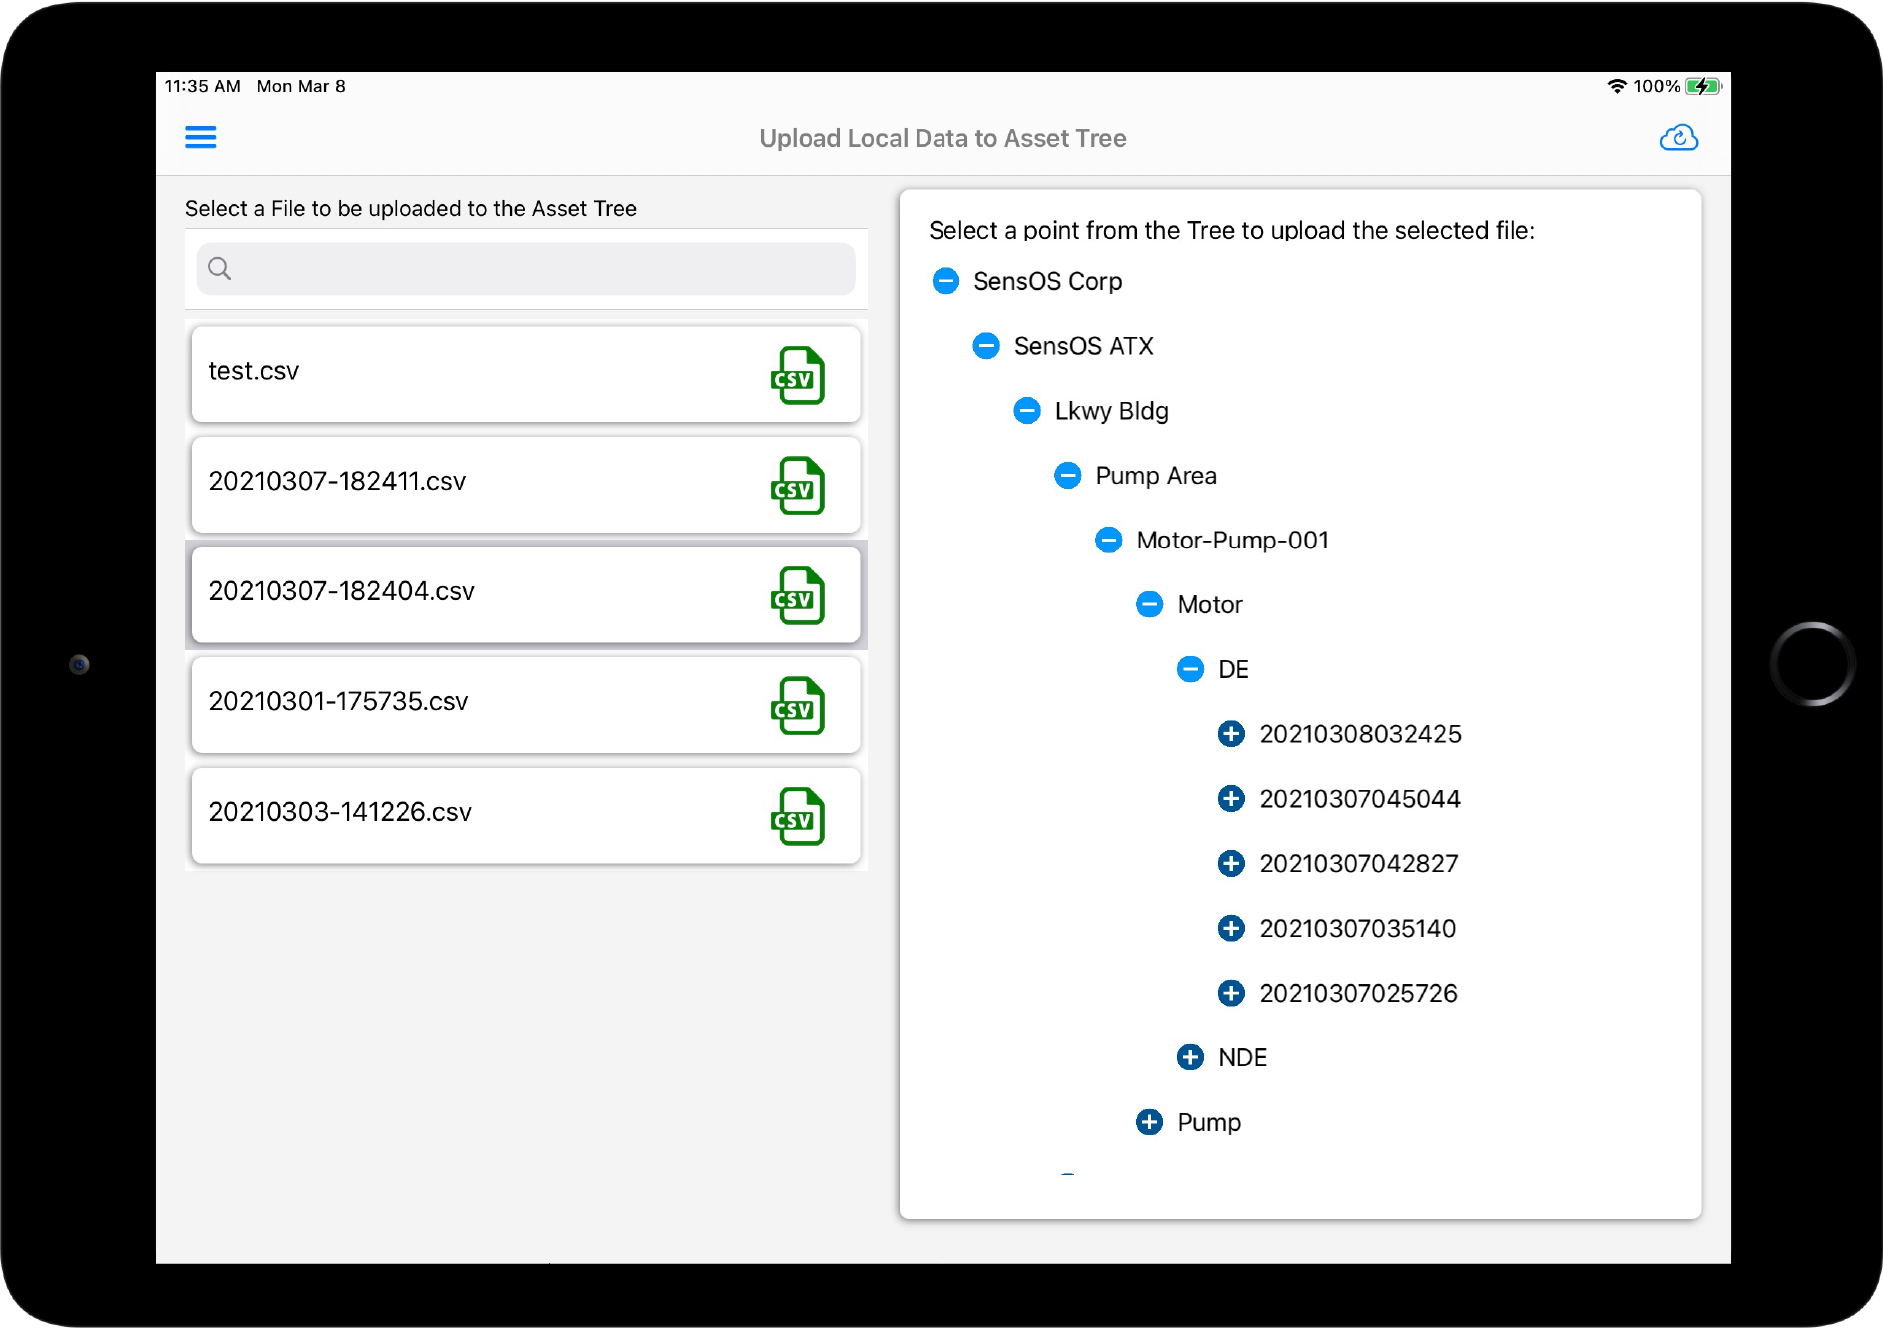
-Select offline stored data and upload to the cloud -Transfer the data to a specific point of the Asset Tree
Generate and Markup the Report
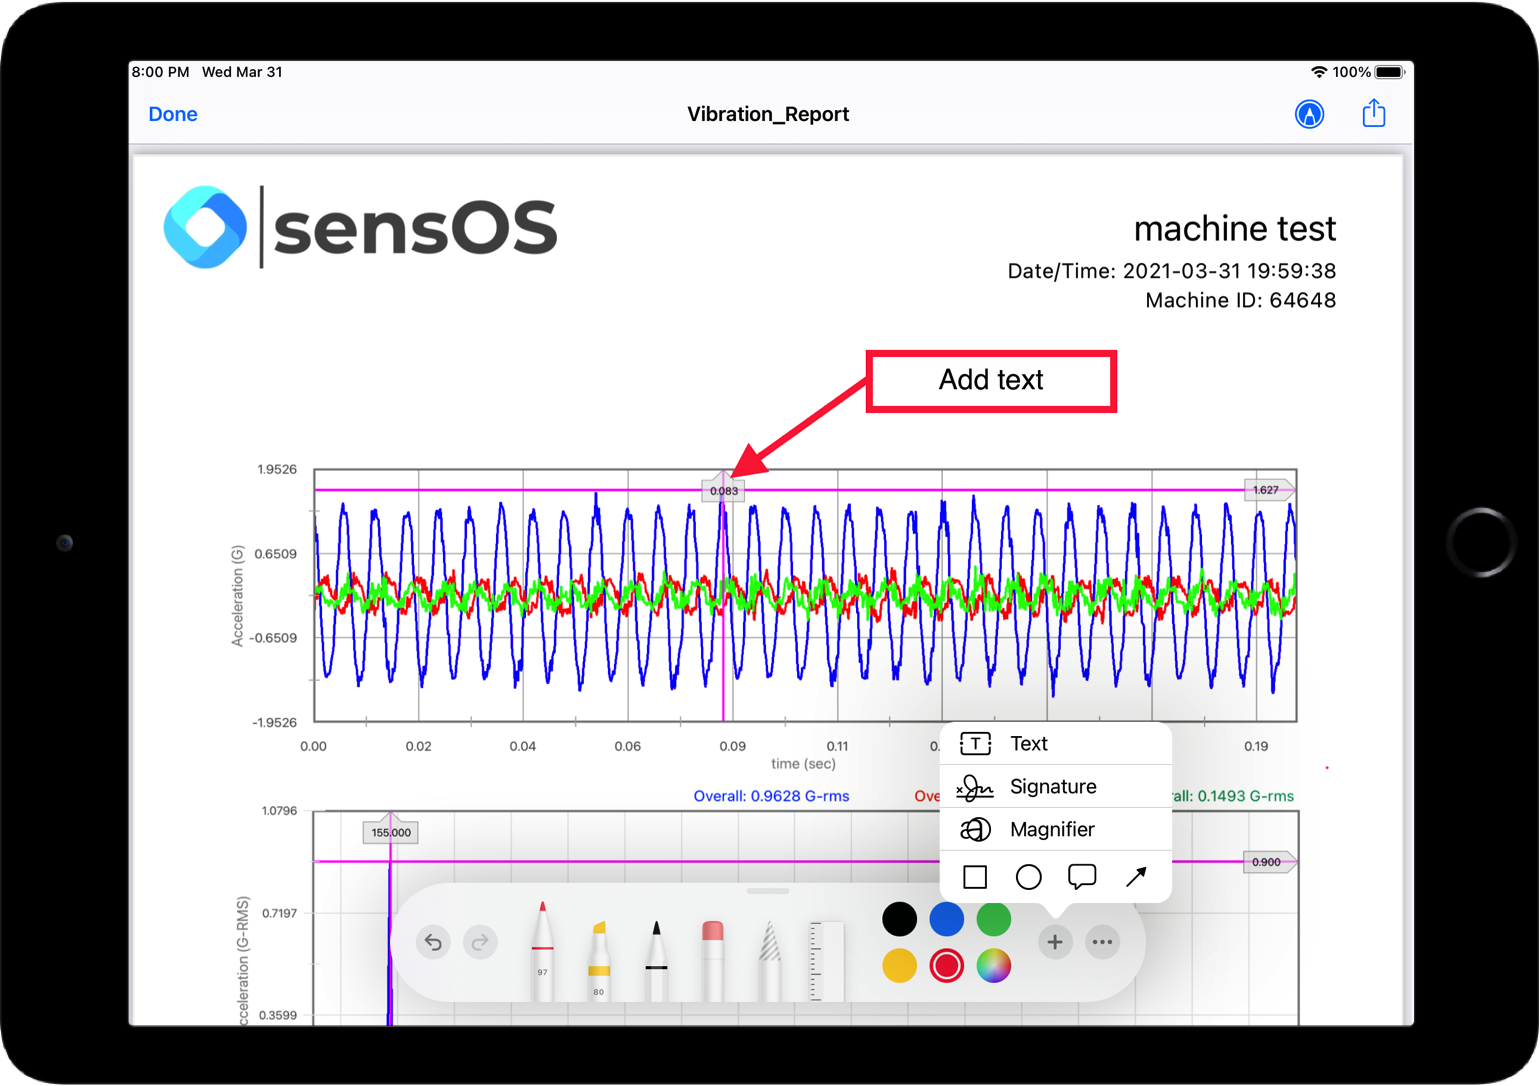
-Generate report with one button -Markup, sign and modify pdf before sharing -Share by Email, Airdrop, Messages, etc