Documentation
Machine Baseline
MS-3934: Vibration Analysis Studio iPadOS® version
- Version: 1.49 (b.126)
- Author: D. Bukowitz
- Created: 01 Apr, 2021
- Update: 21 Nov, 2022
If you have any questions that are beyond the scope of this document, Please feel free to email via info@sens-os.com
Description
This feature will allow the user to create machine/points and store a vibration baseline to be used as reference for actual measurements.
Compatibility
This module is compatible with the following sensors:
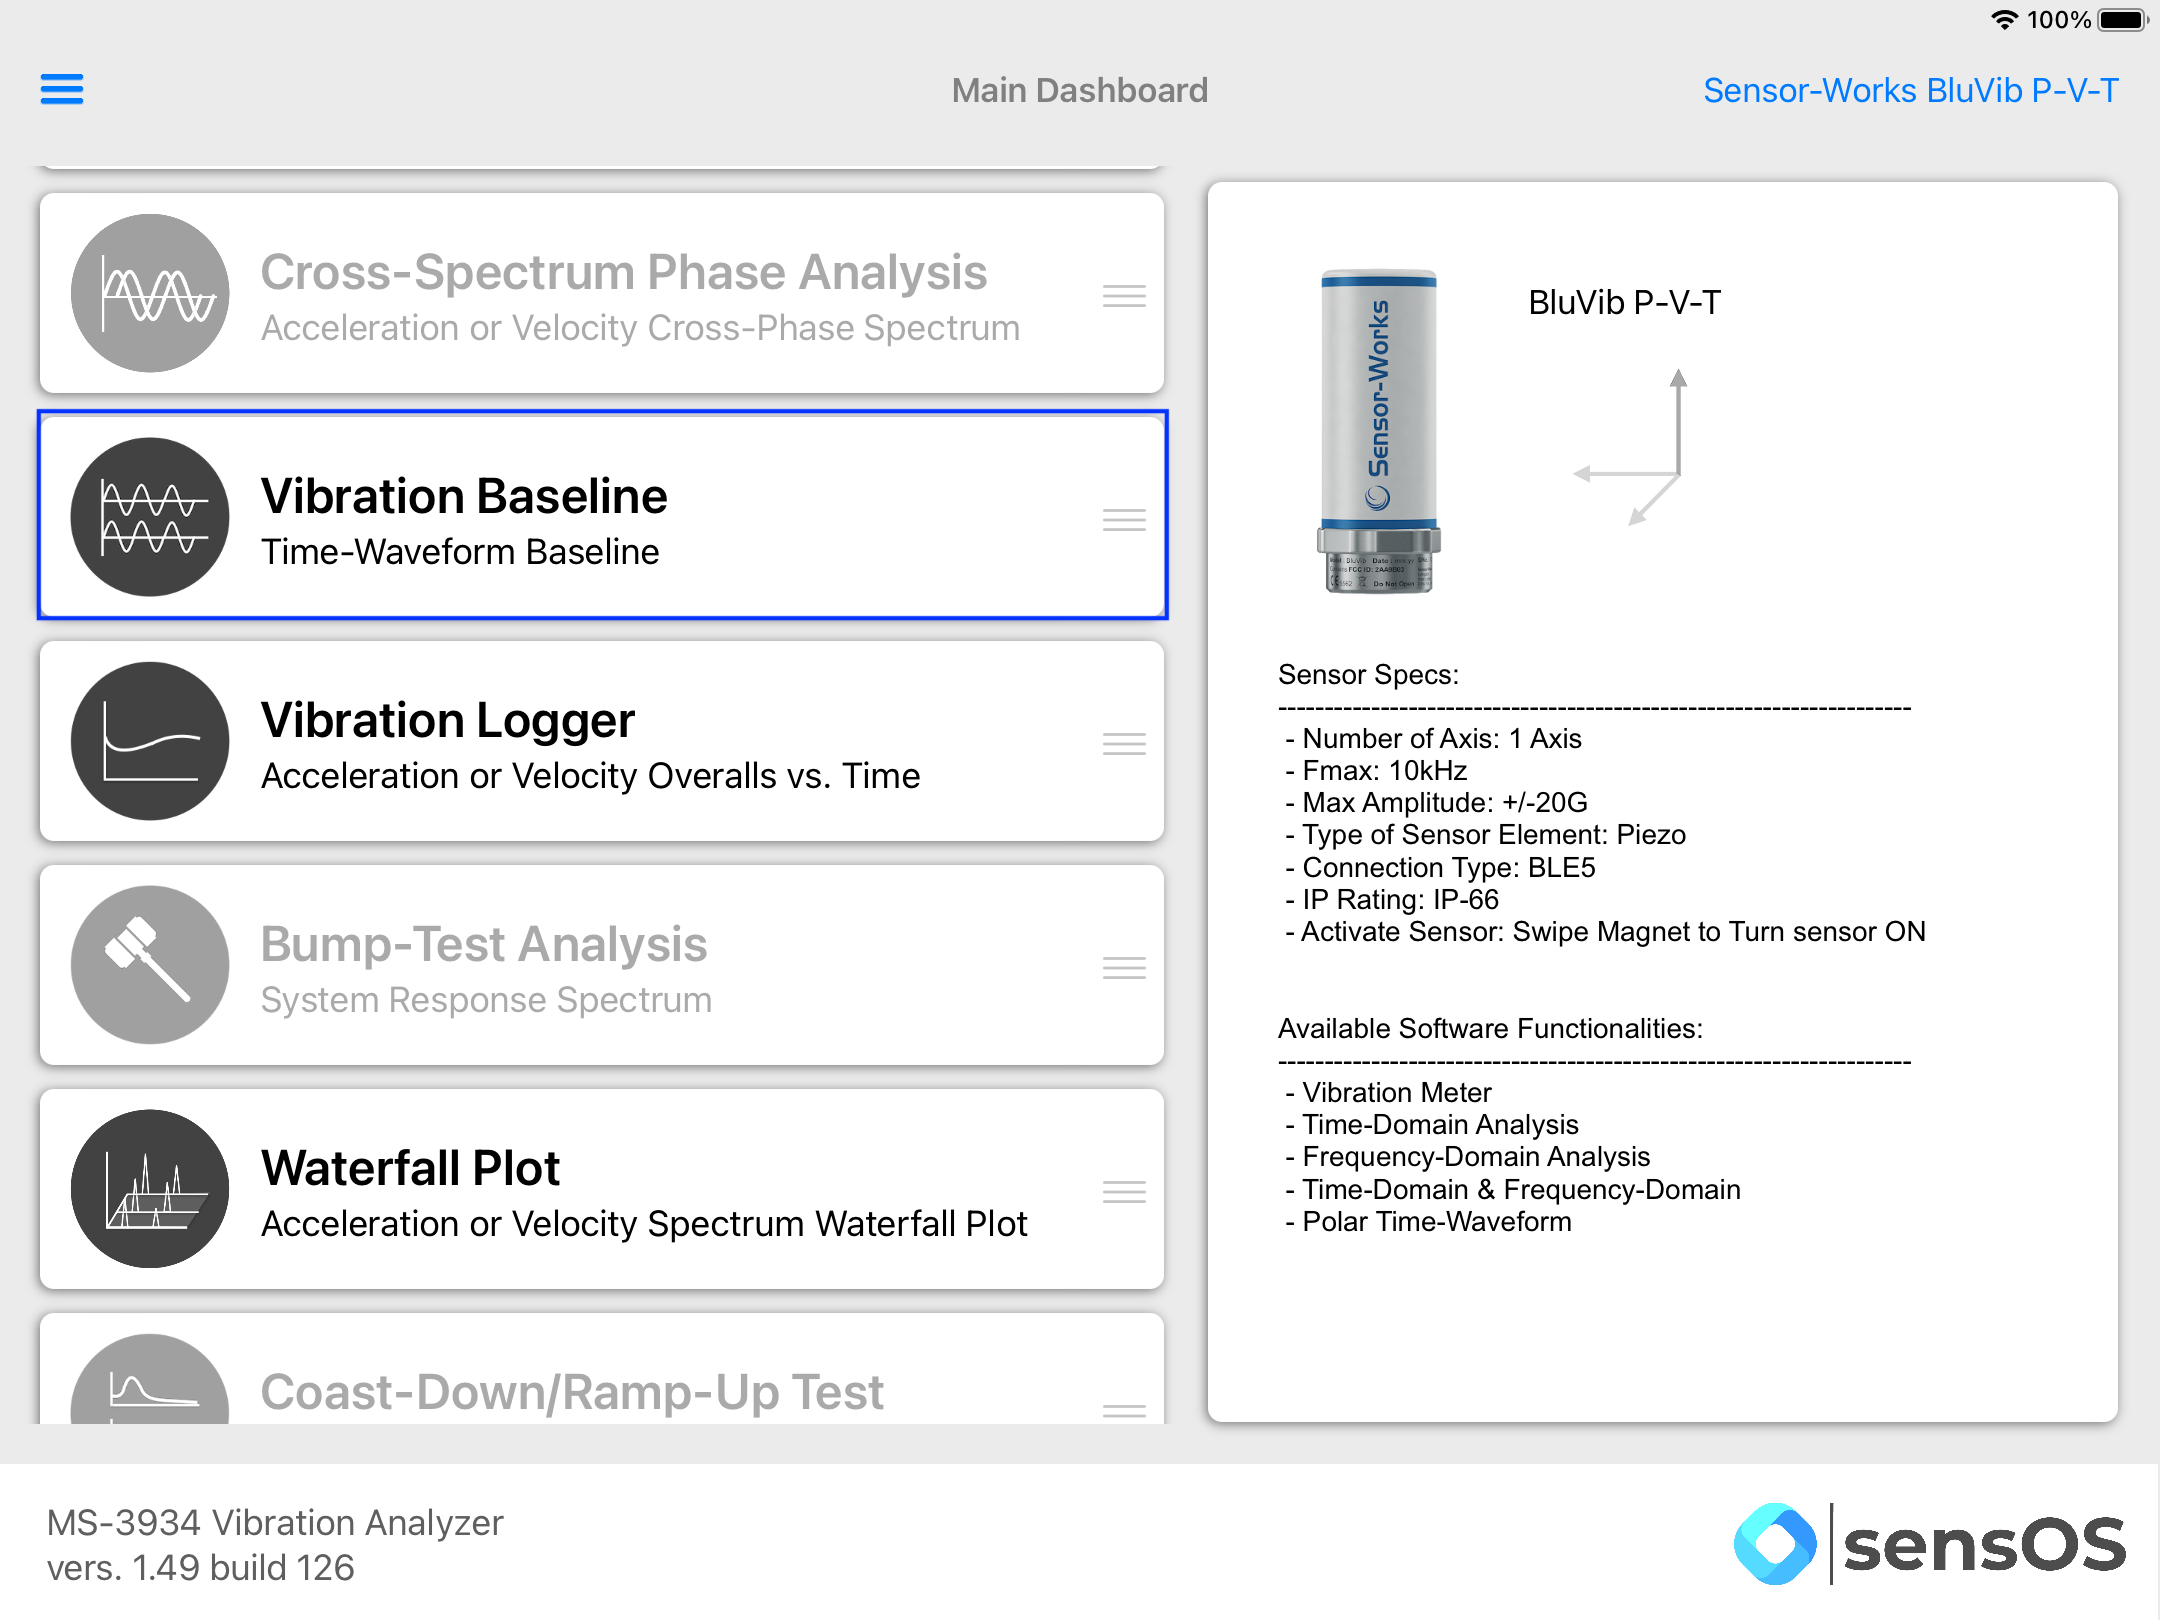
- SensorWorks BluVib P-V-T
1-Channel / Wireless BLE Sensor
Fmax: Up to 10,000 Hz
Spectral Lines of Resolution: Up to 12,800
Use
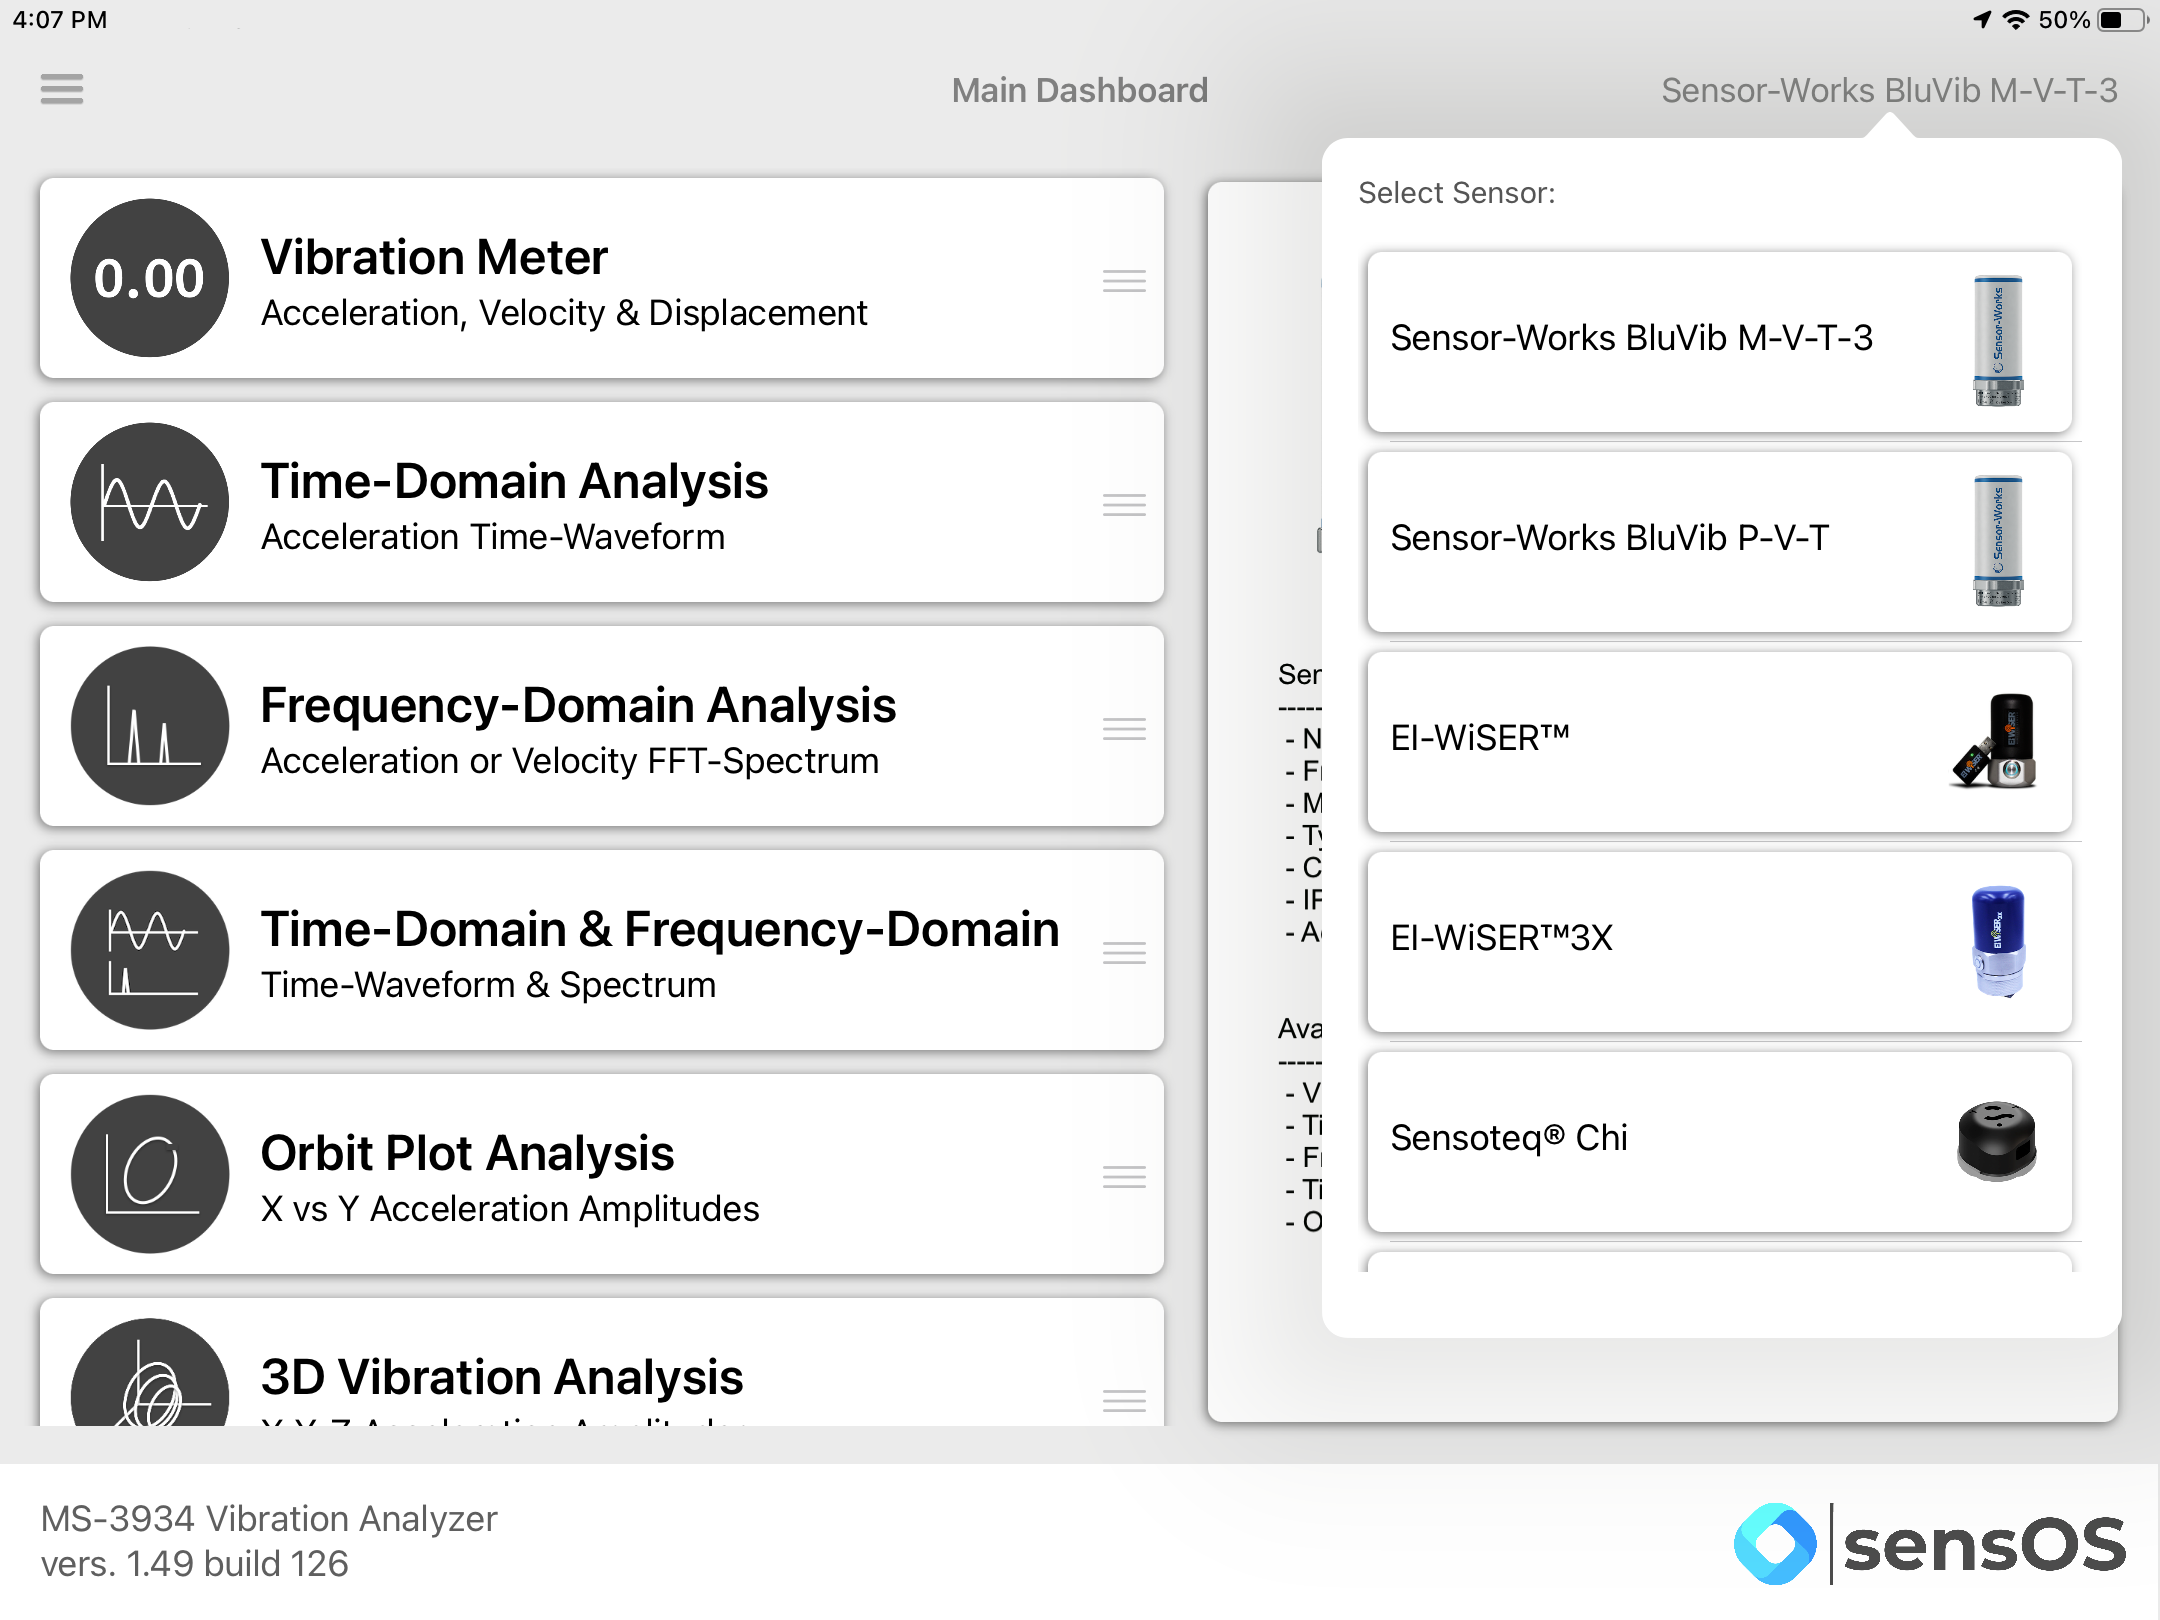
- Tap on the Sensor name button to open the list of available sensors, and select the sensor type from the list
- Select Vibration Baseline from the options list
Note: The user can change the order of the functionalities in the list by dragging it from the right button on each cell
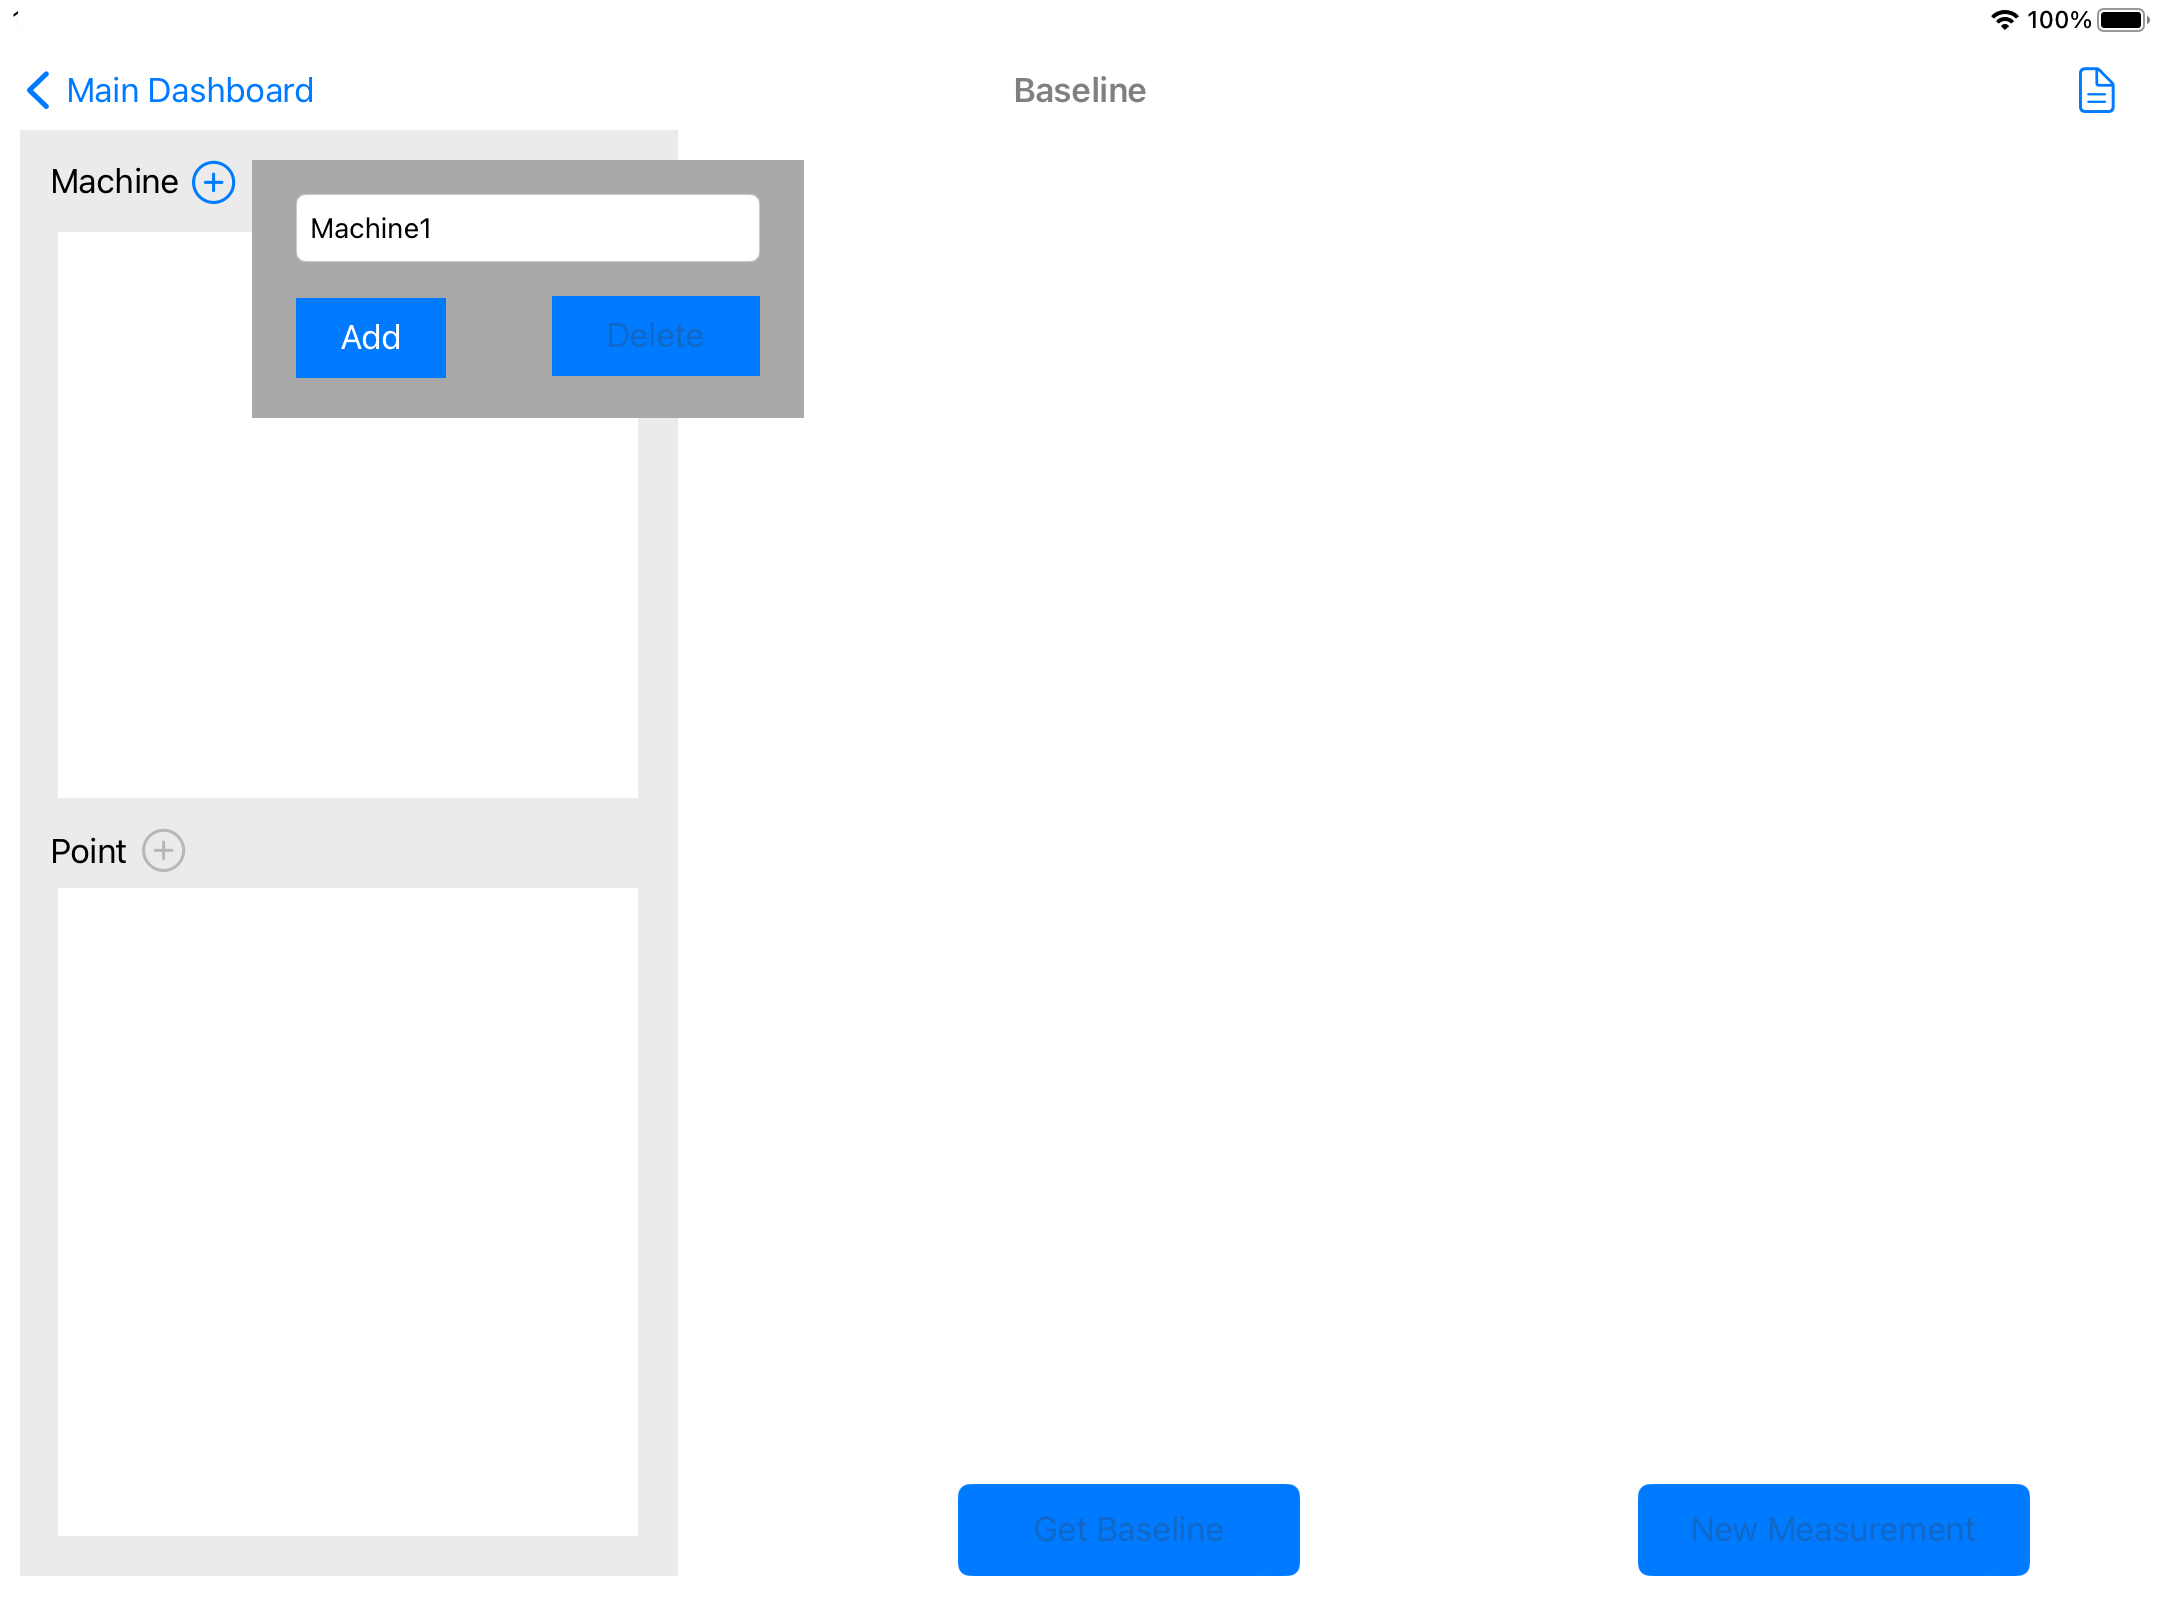
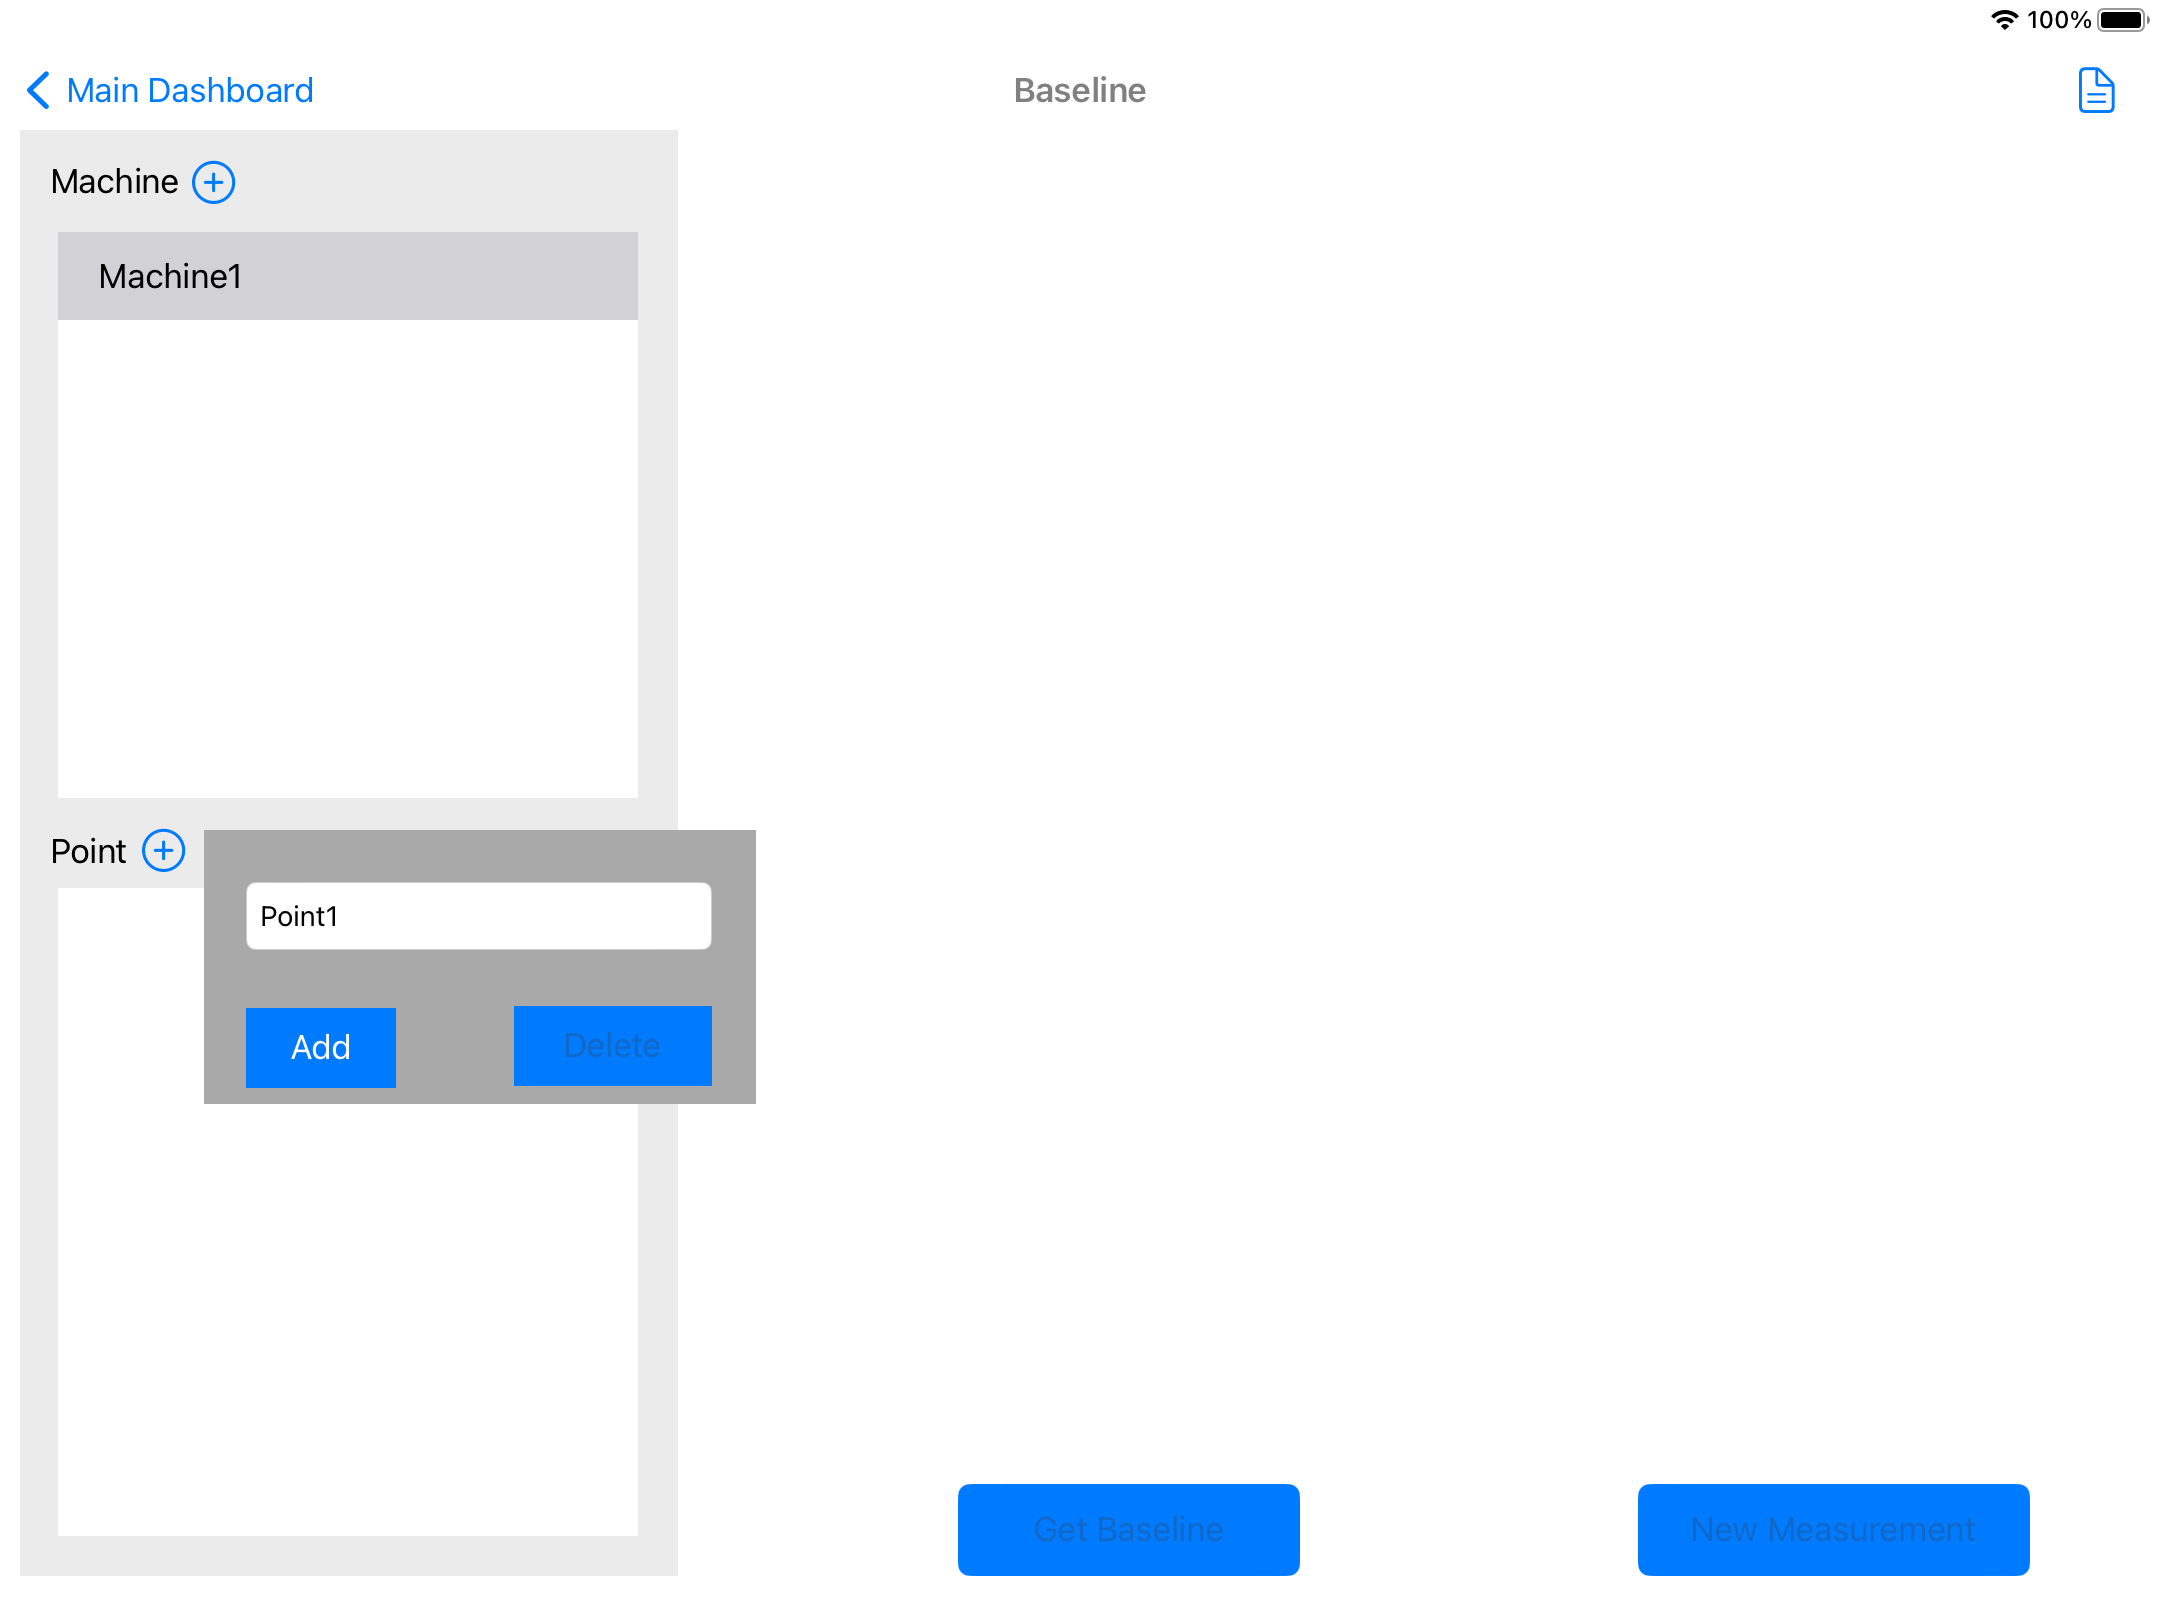
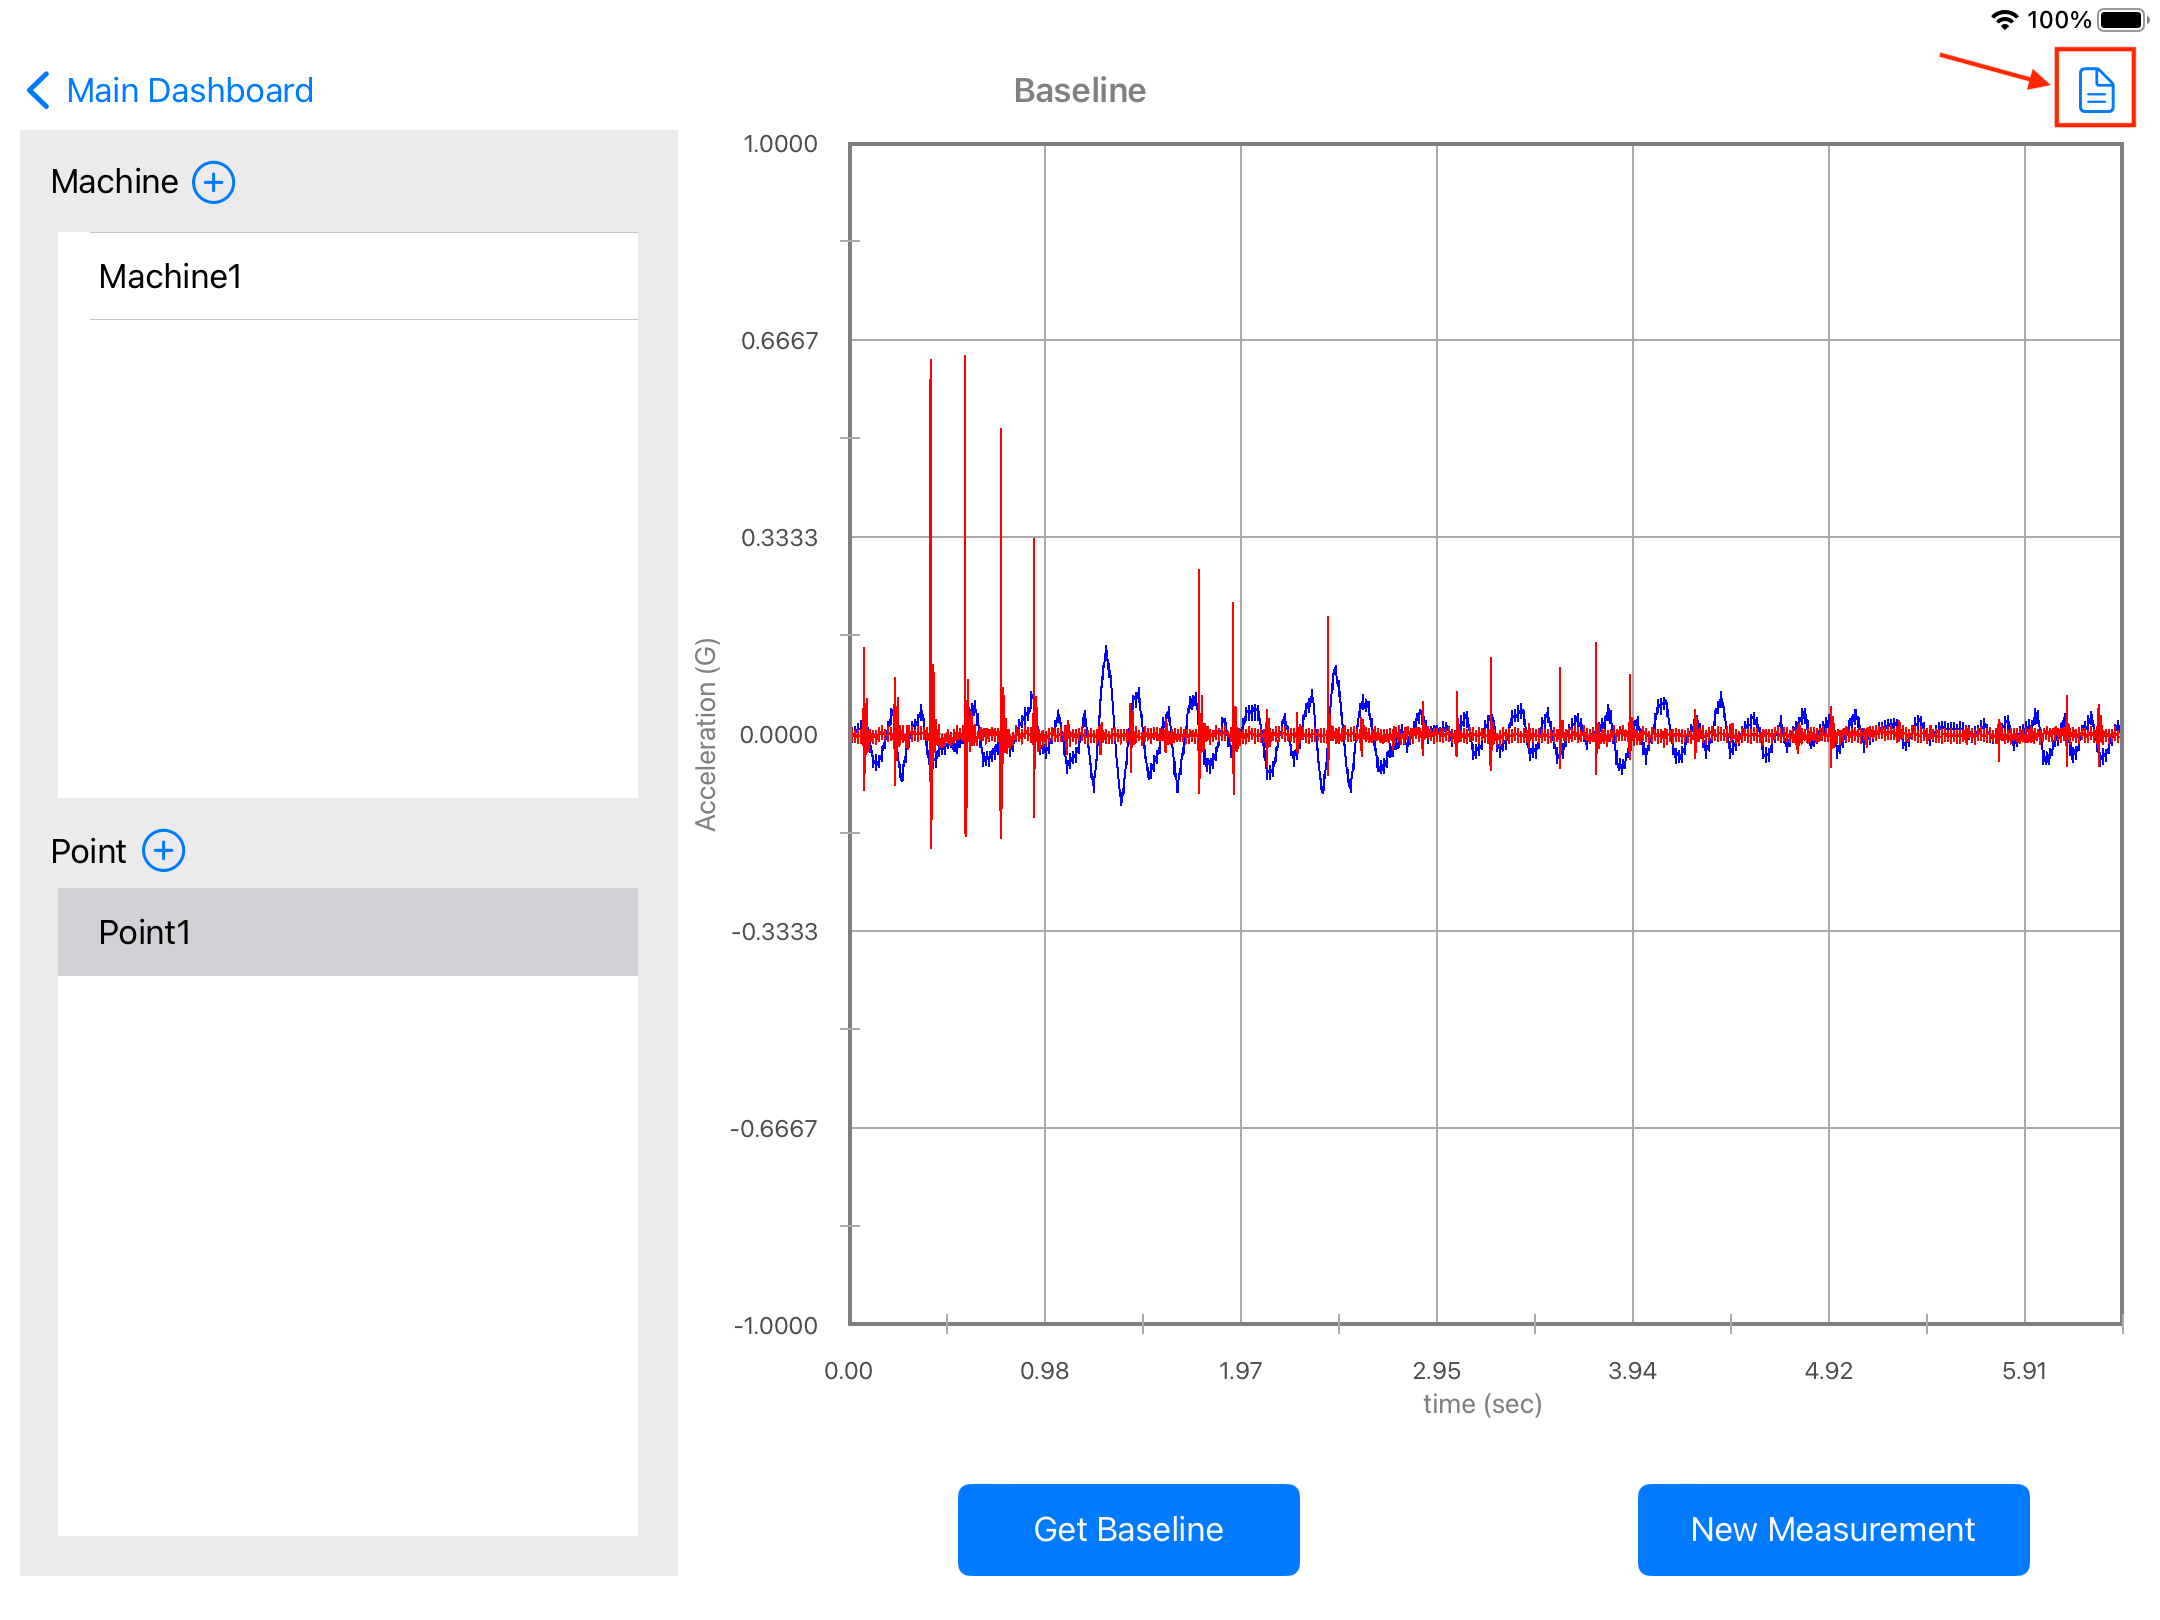
Create New Baseline
- To create a new baseline, add a new machine to the database, click the "+" button and type the name of the machine, then press "Add", close the dialog box by pressing the "+" button again.
- Select the Machine, to add Points.
- Add a new point to a machine, click the "+" button and type the name of the point, then press "Add", close the dialog box by pressing the "+" button again.
- Select a Point (A pop-up message will appear becasue the point will not have a baseline, click OK), and swipe a magnet to the sensor to turn it ON, the "Get Baseline" button will be now enabled. Set the sensor in the machine and tap the "Get Baseline" button to collect a new baseline.
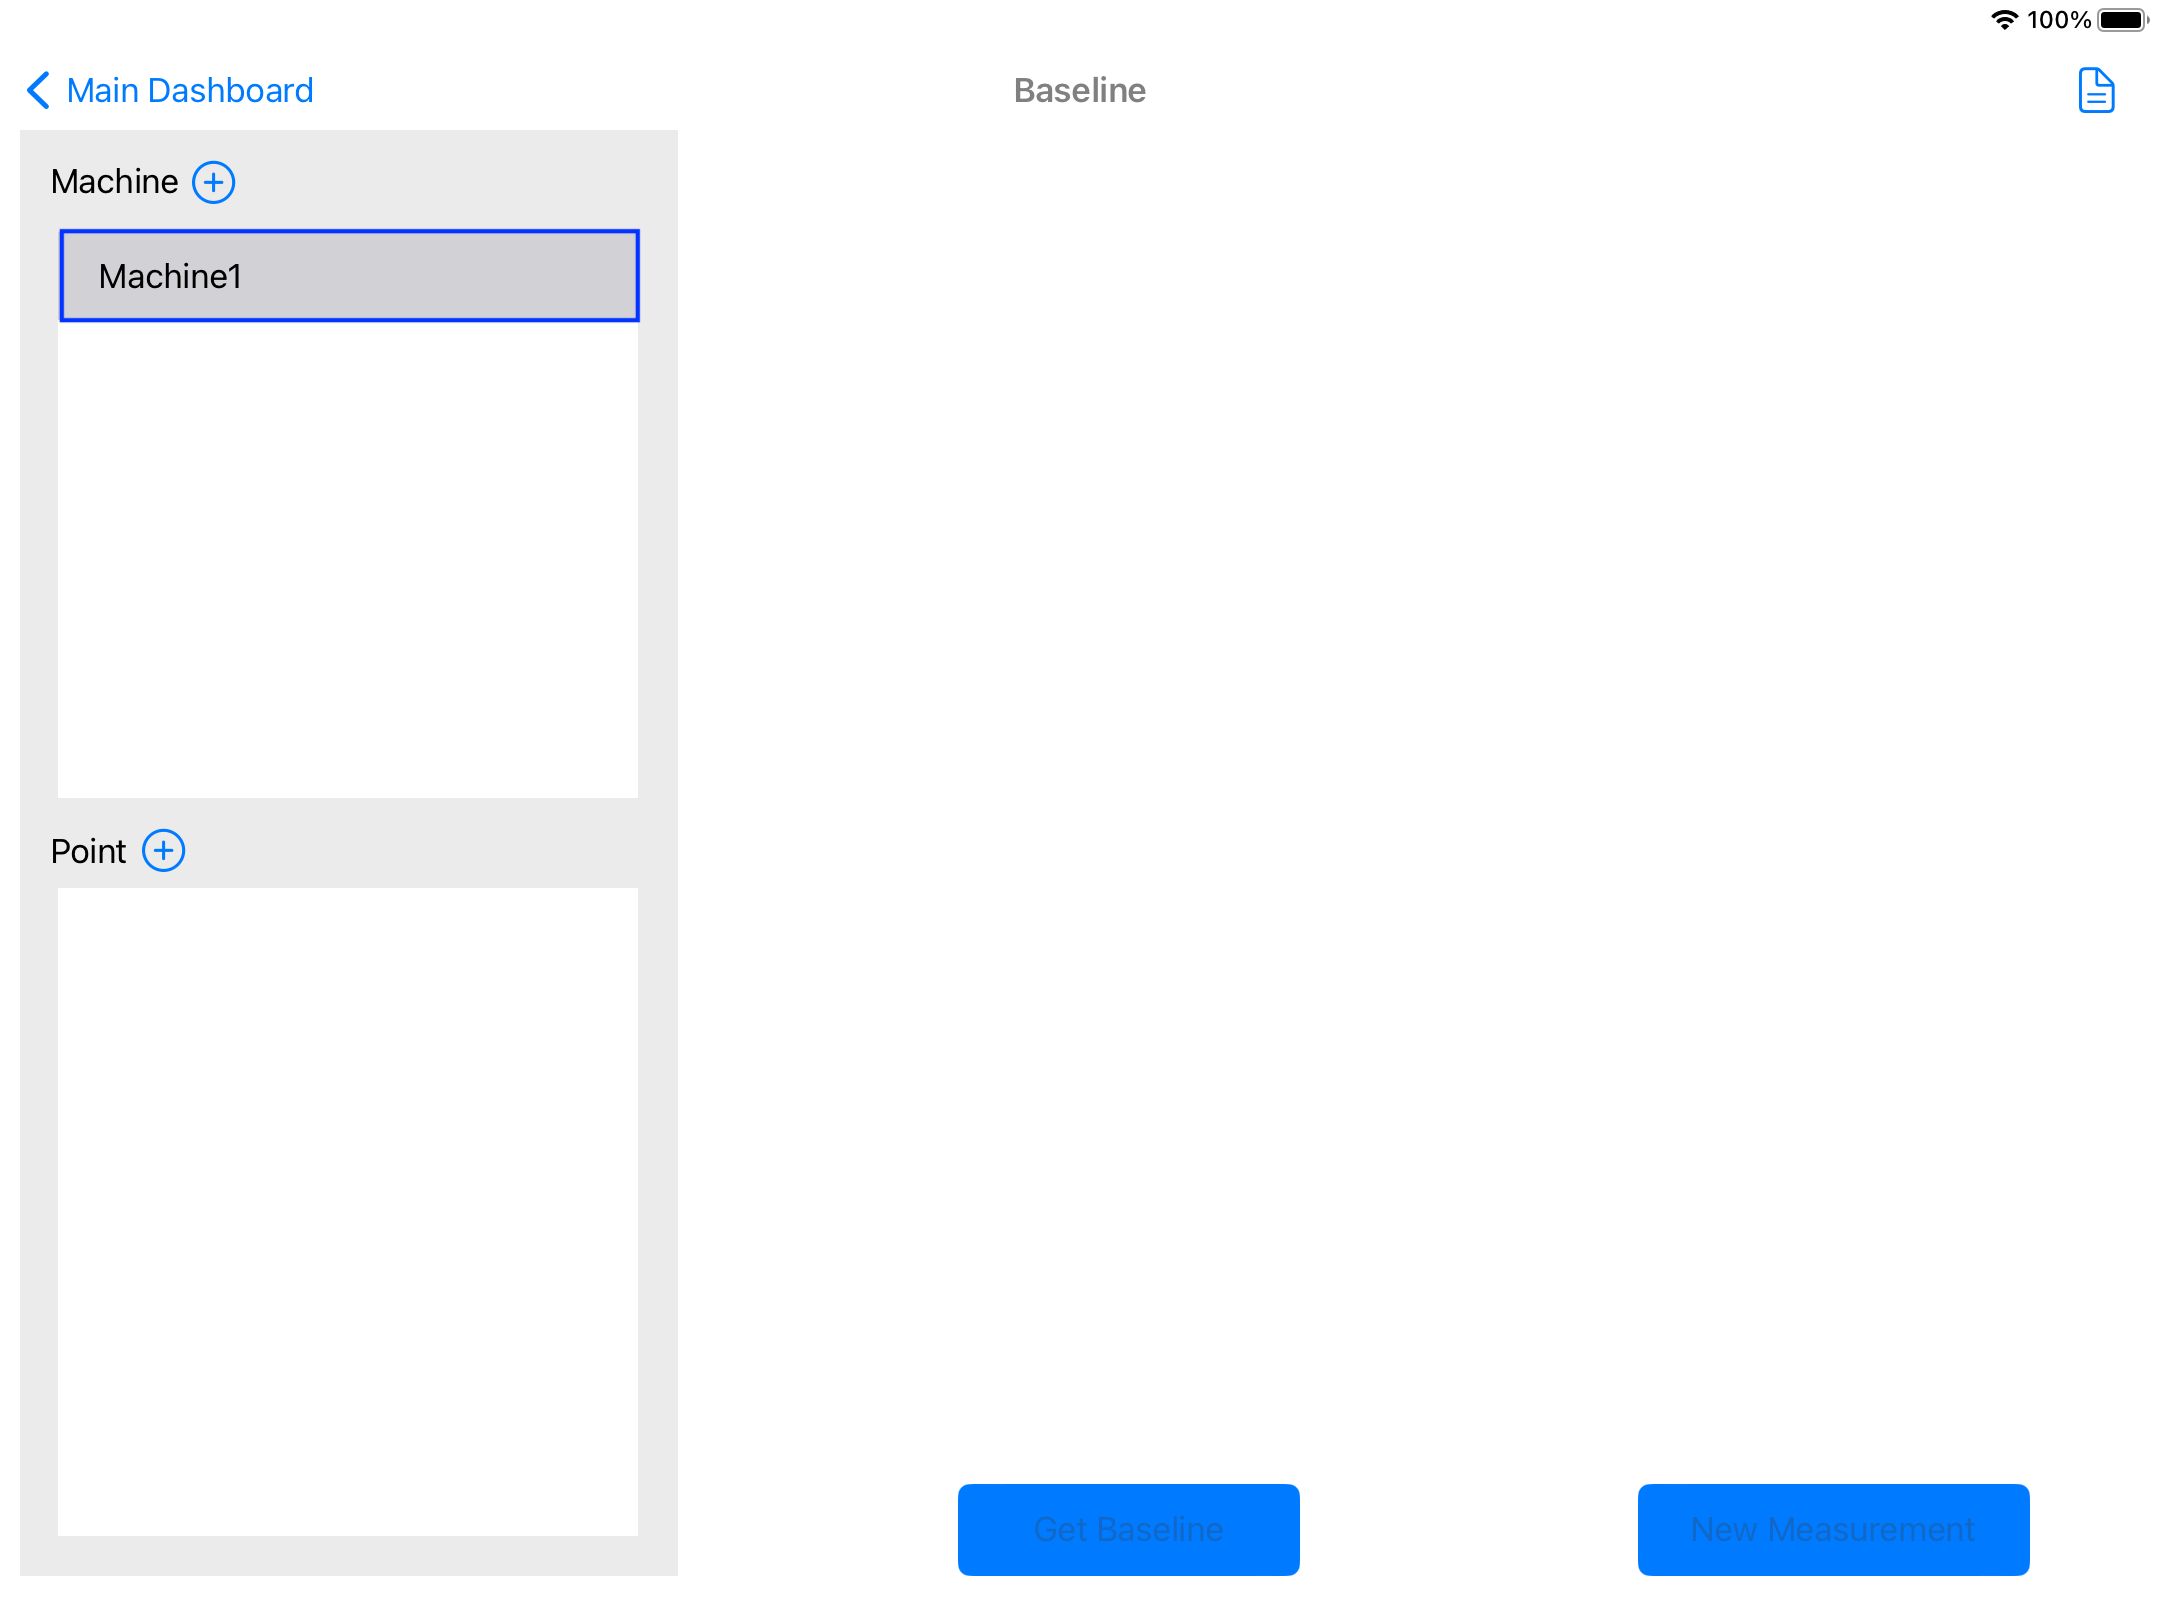
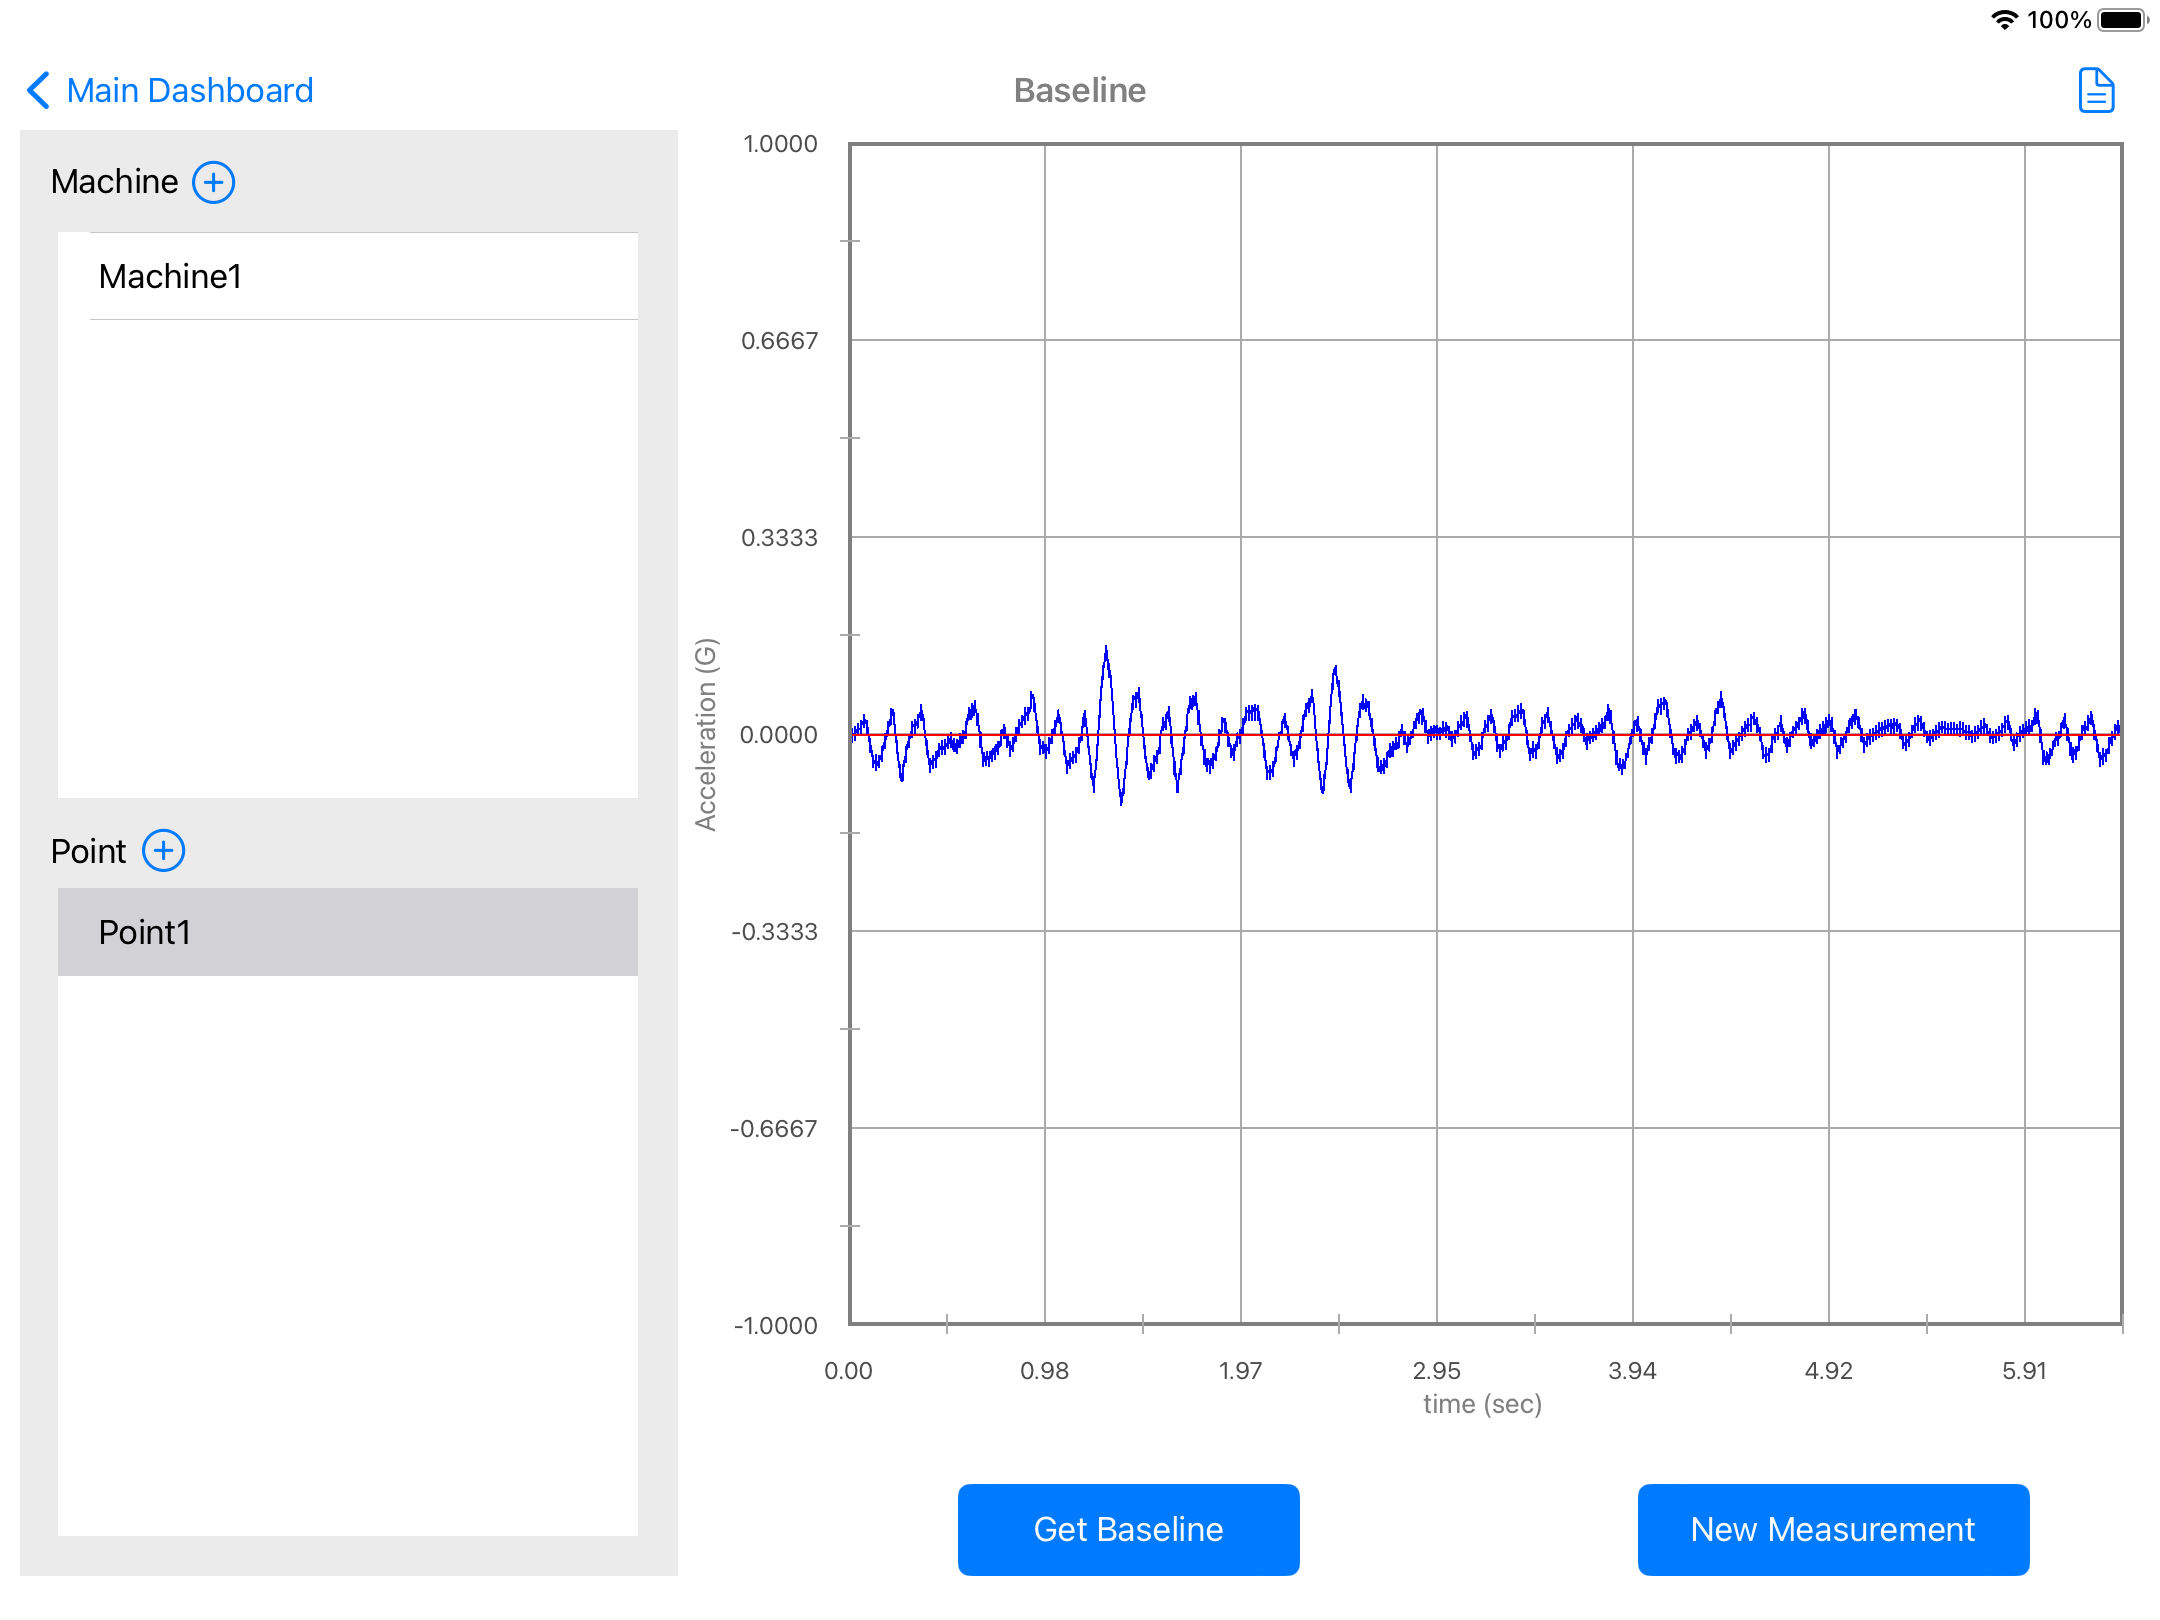
Note: The user can create as many machines and points for each machine as desired and store their baseline for future reference.
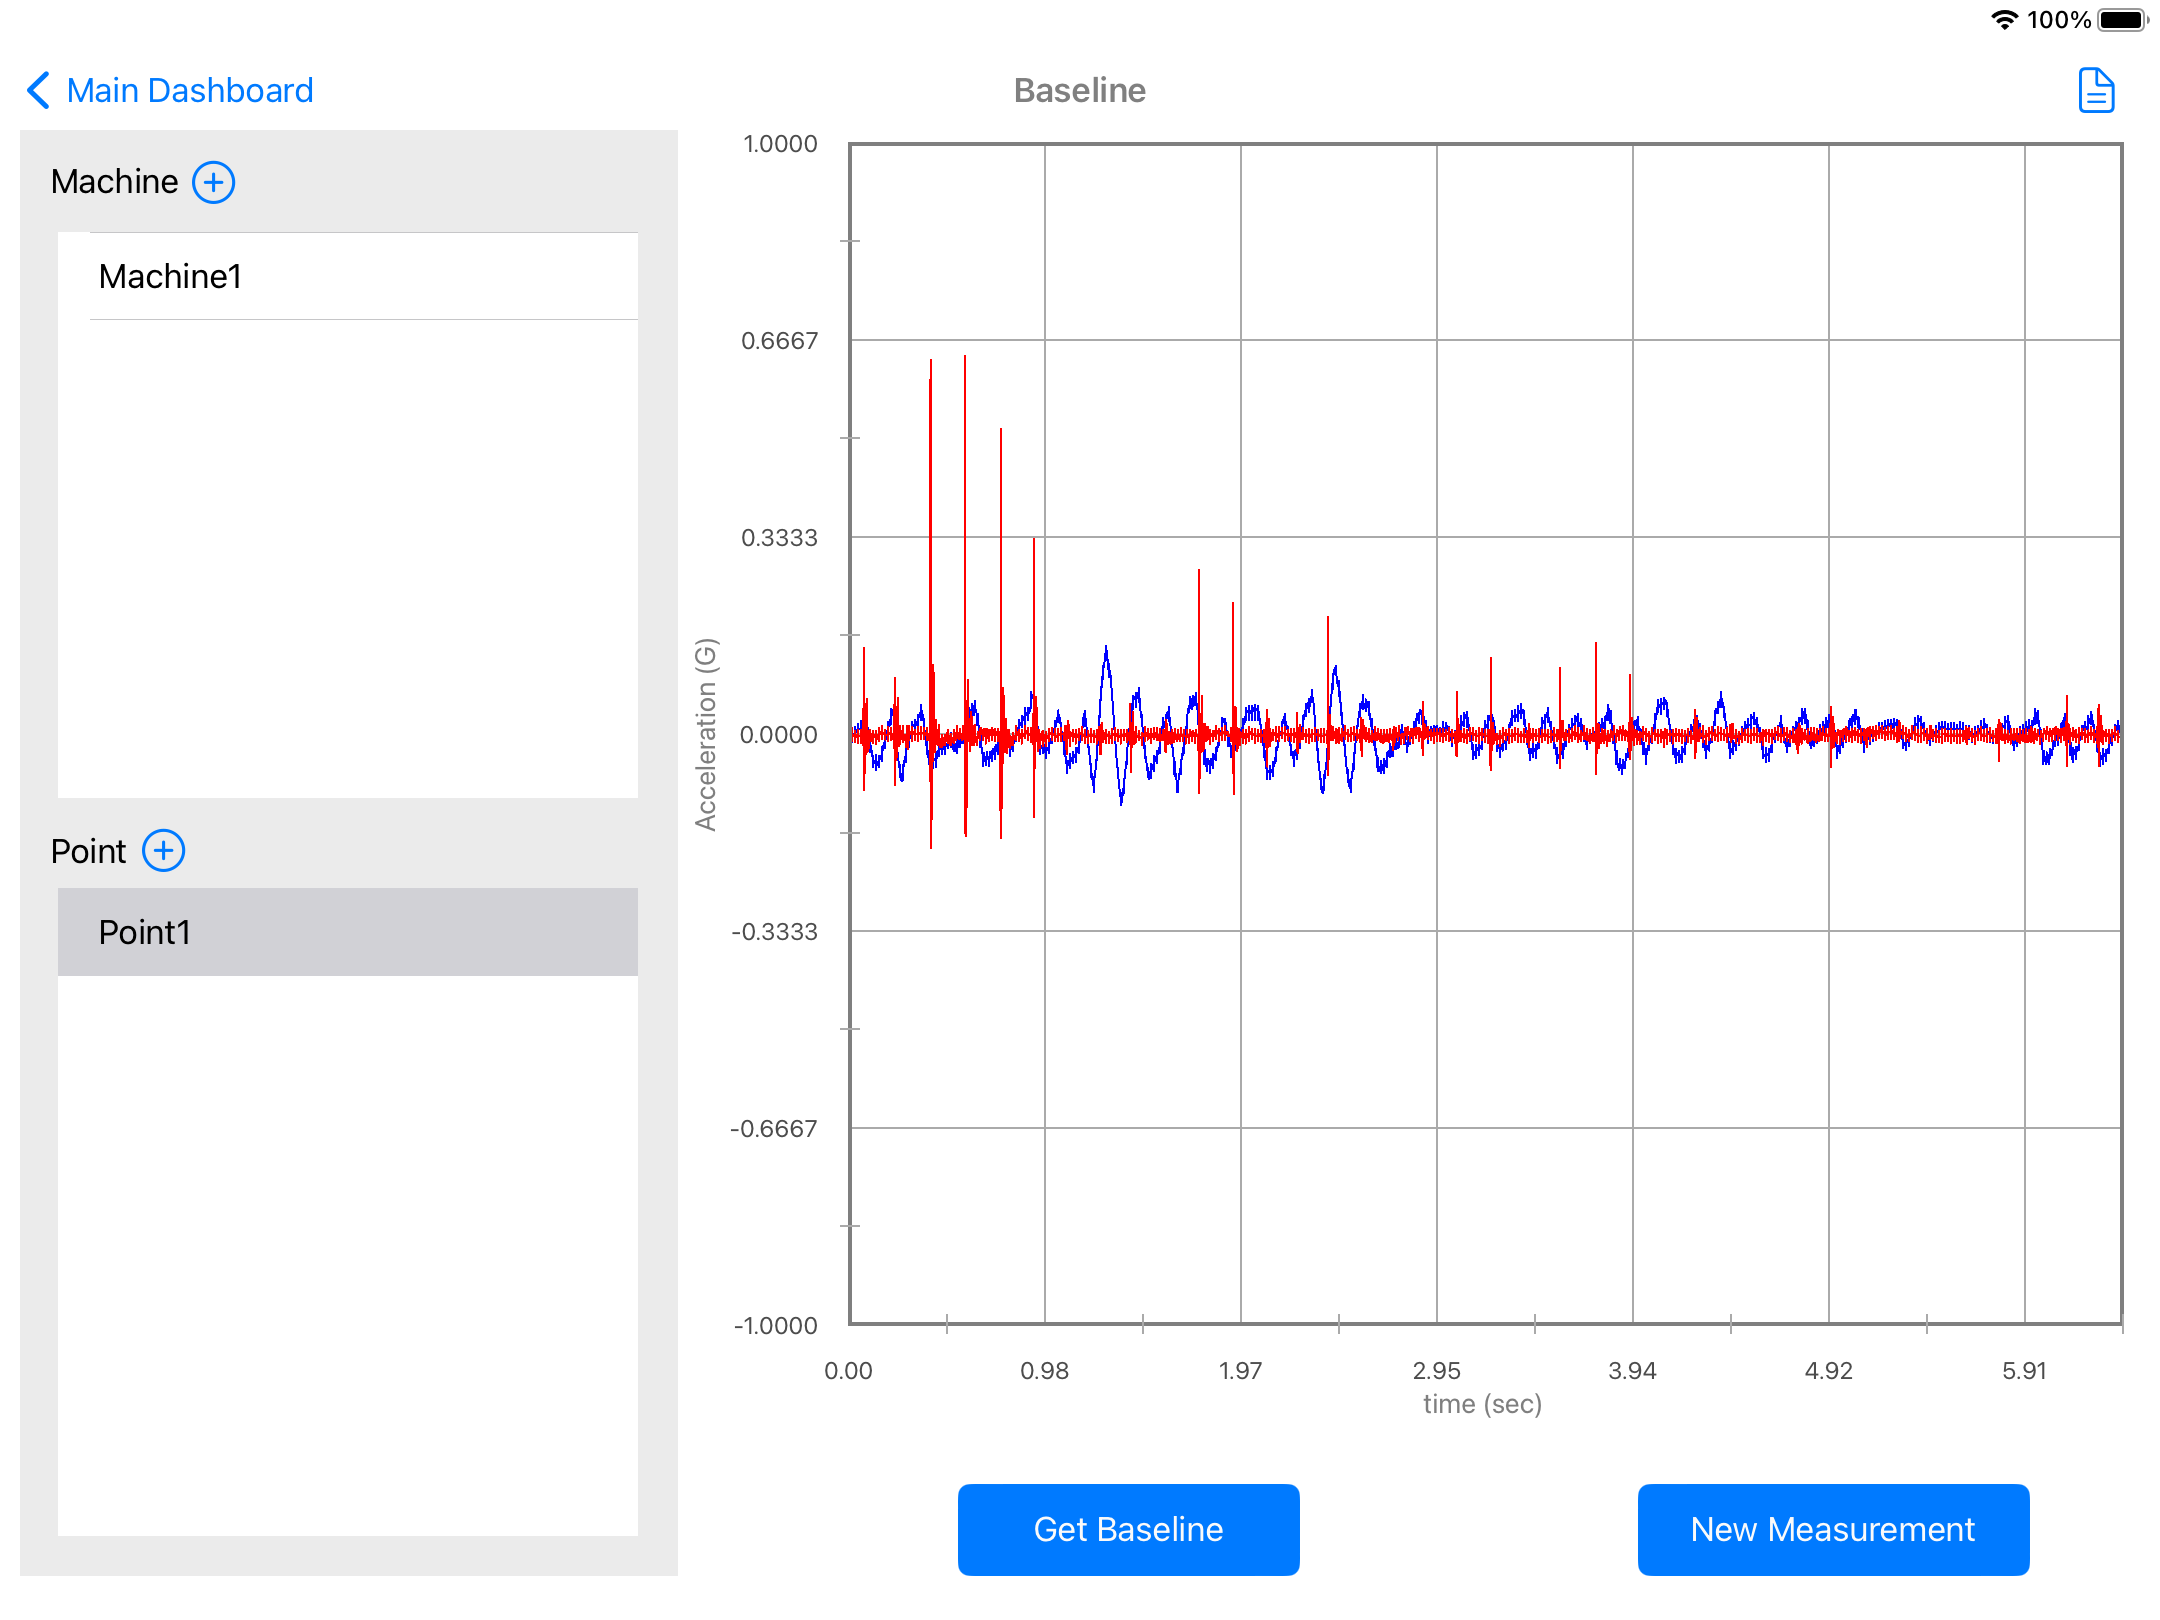
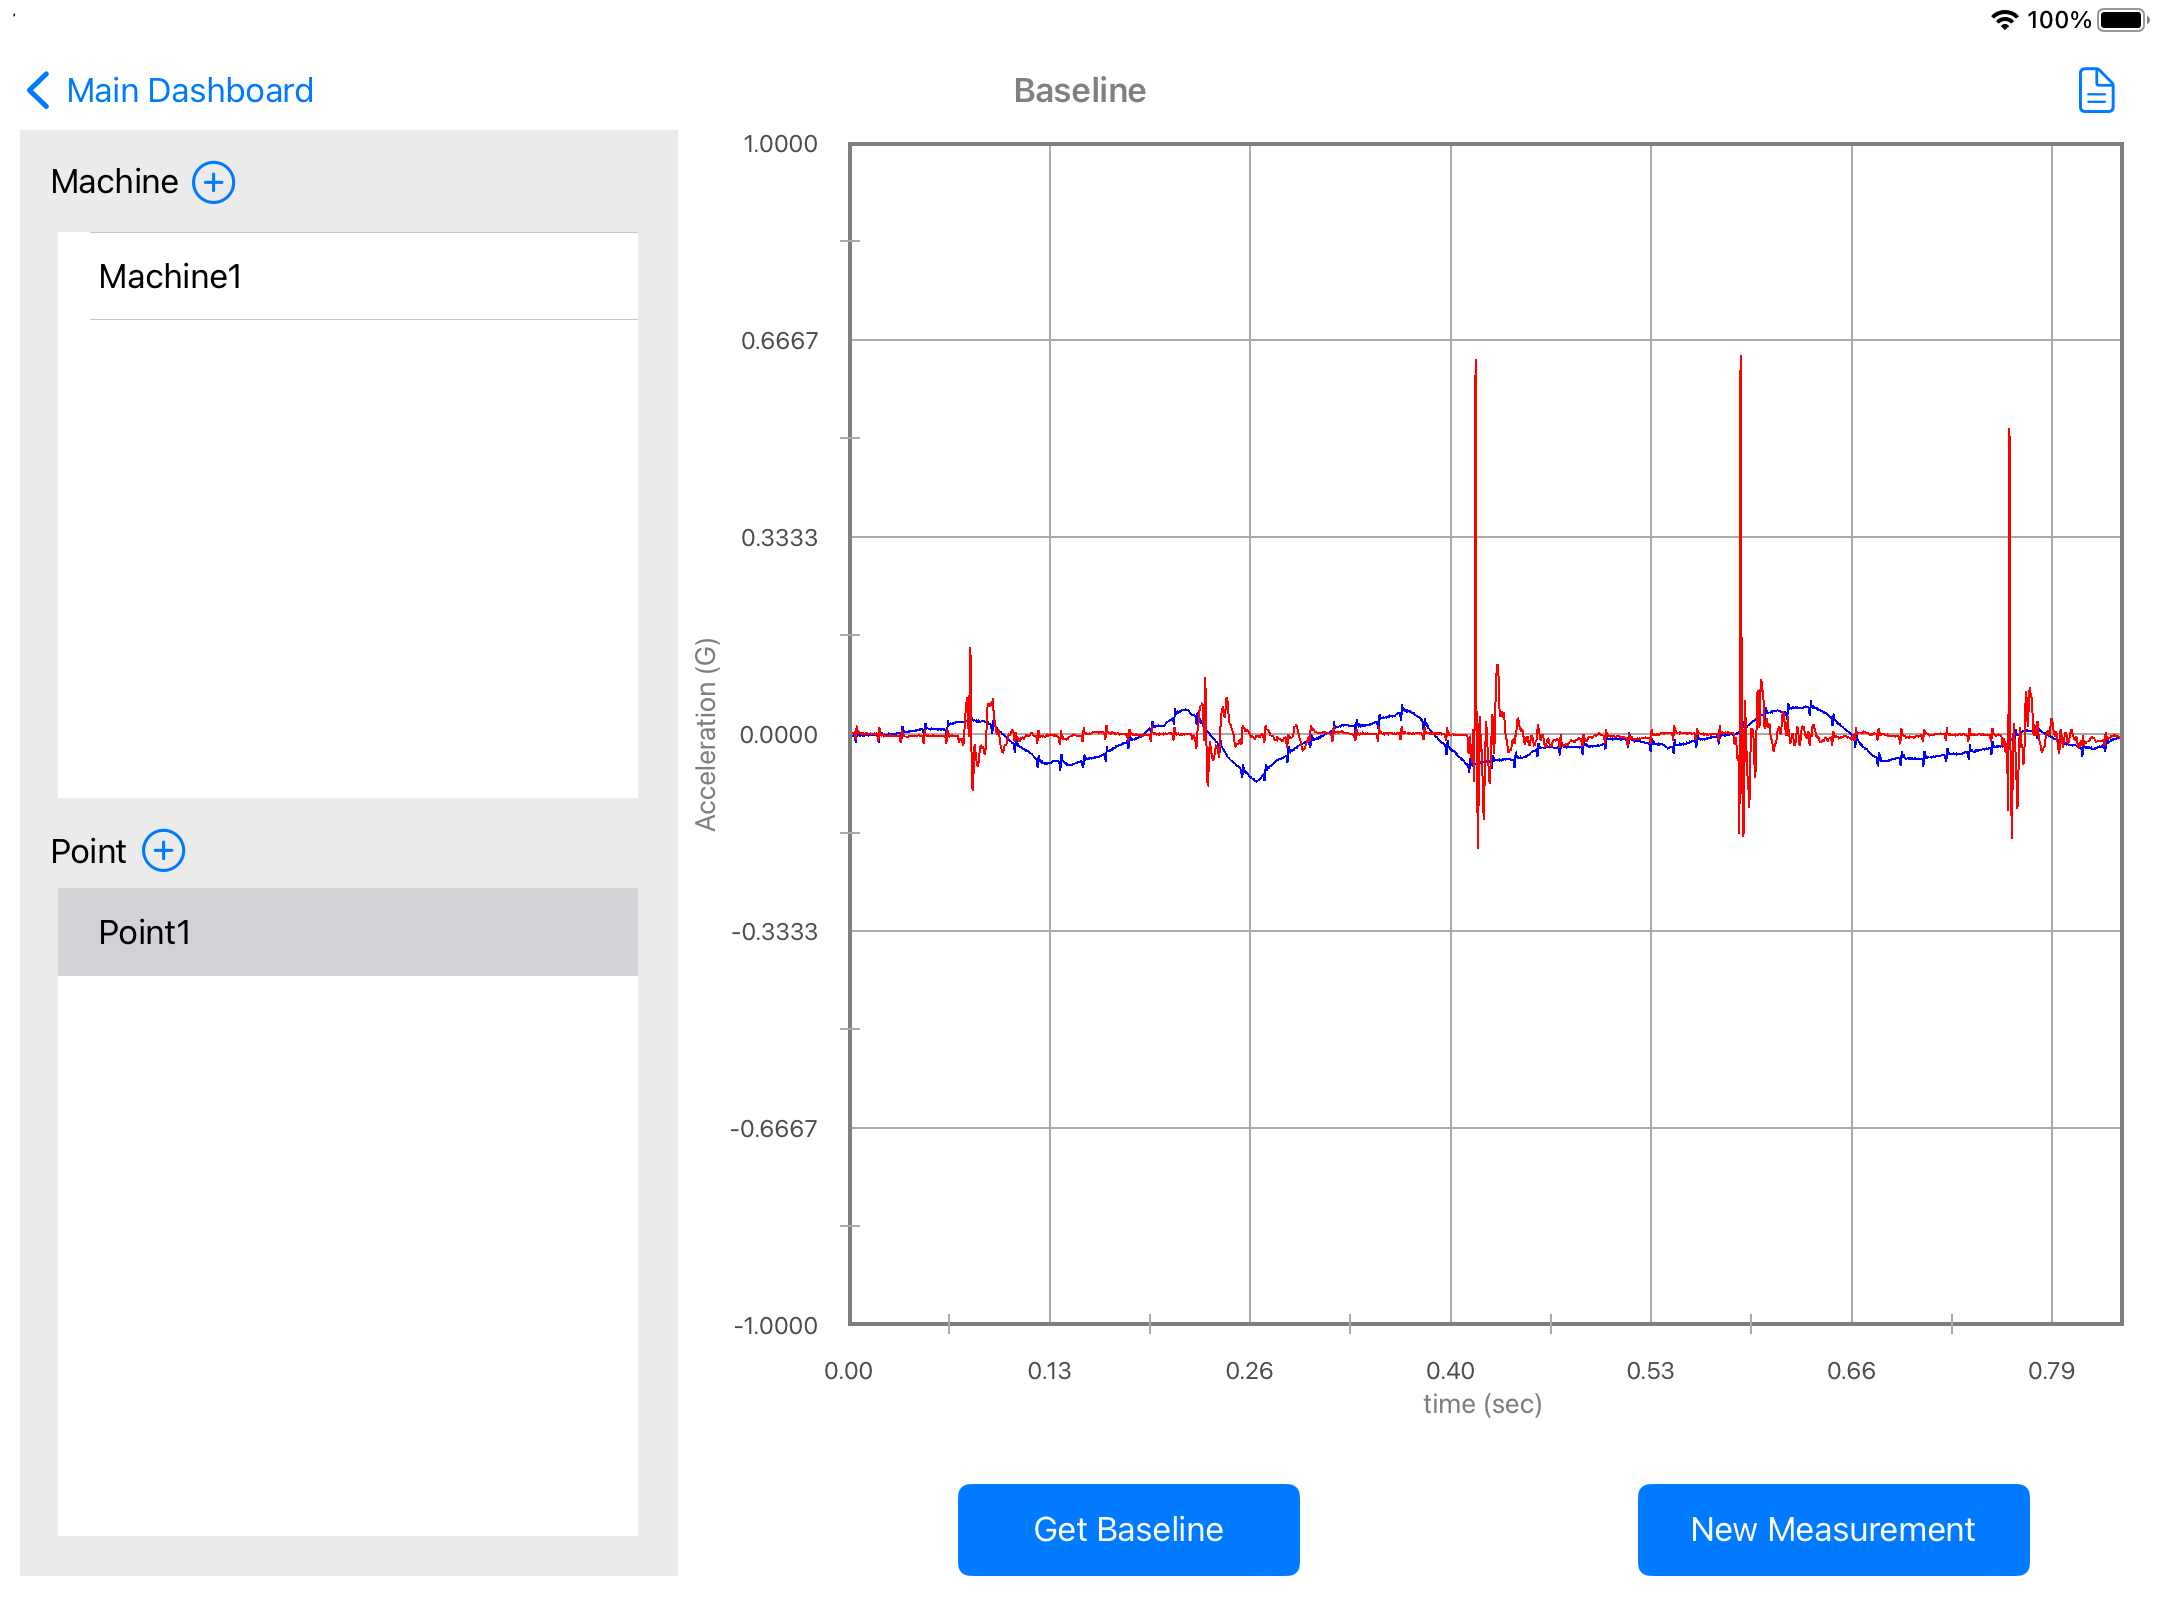
New Reading and Compare
- To take a new reading and compare it with the baseline, select a machine/point from the list, turn the sensor ON, locate it on the same point use to colelct the baseline and press the "New Measurement" button. The new signal will be ploted in red color on top of the original baseline signal (blue).
- The user can now compare the 2 signals, pinch on the plot to zoom in and out.
Note: The user can replace the original baseline with a new one by pressing the "Get Baseline" button at any time.
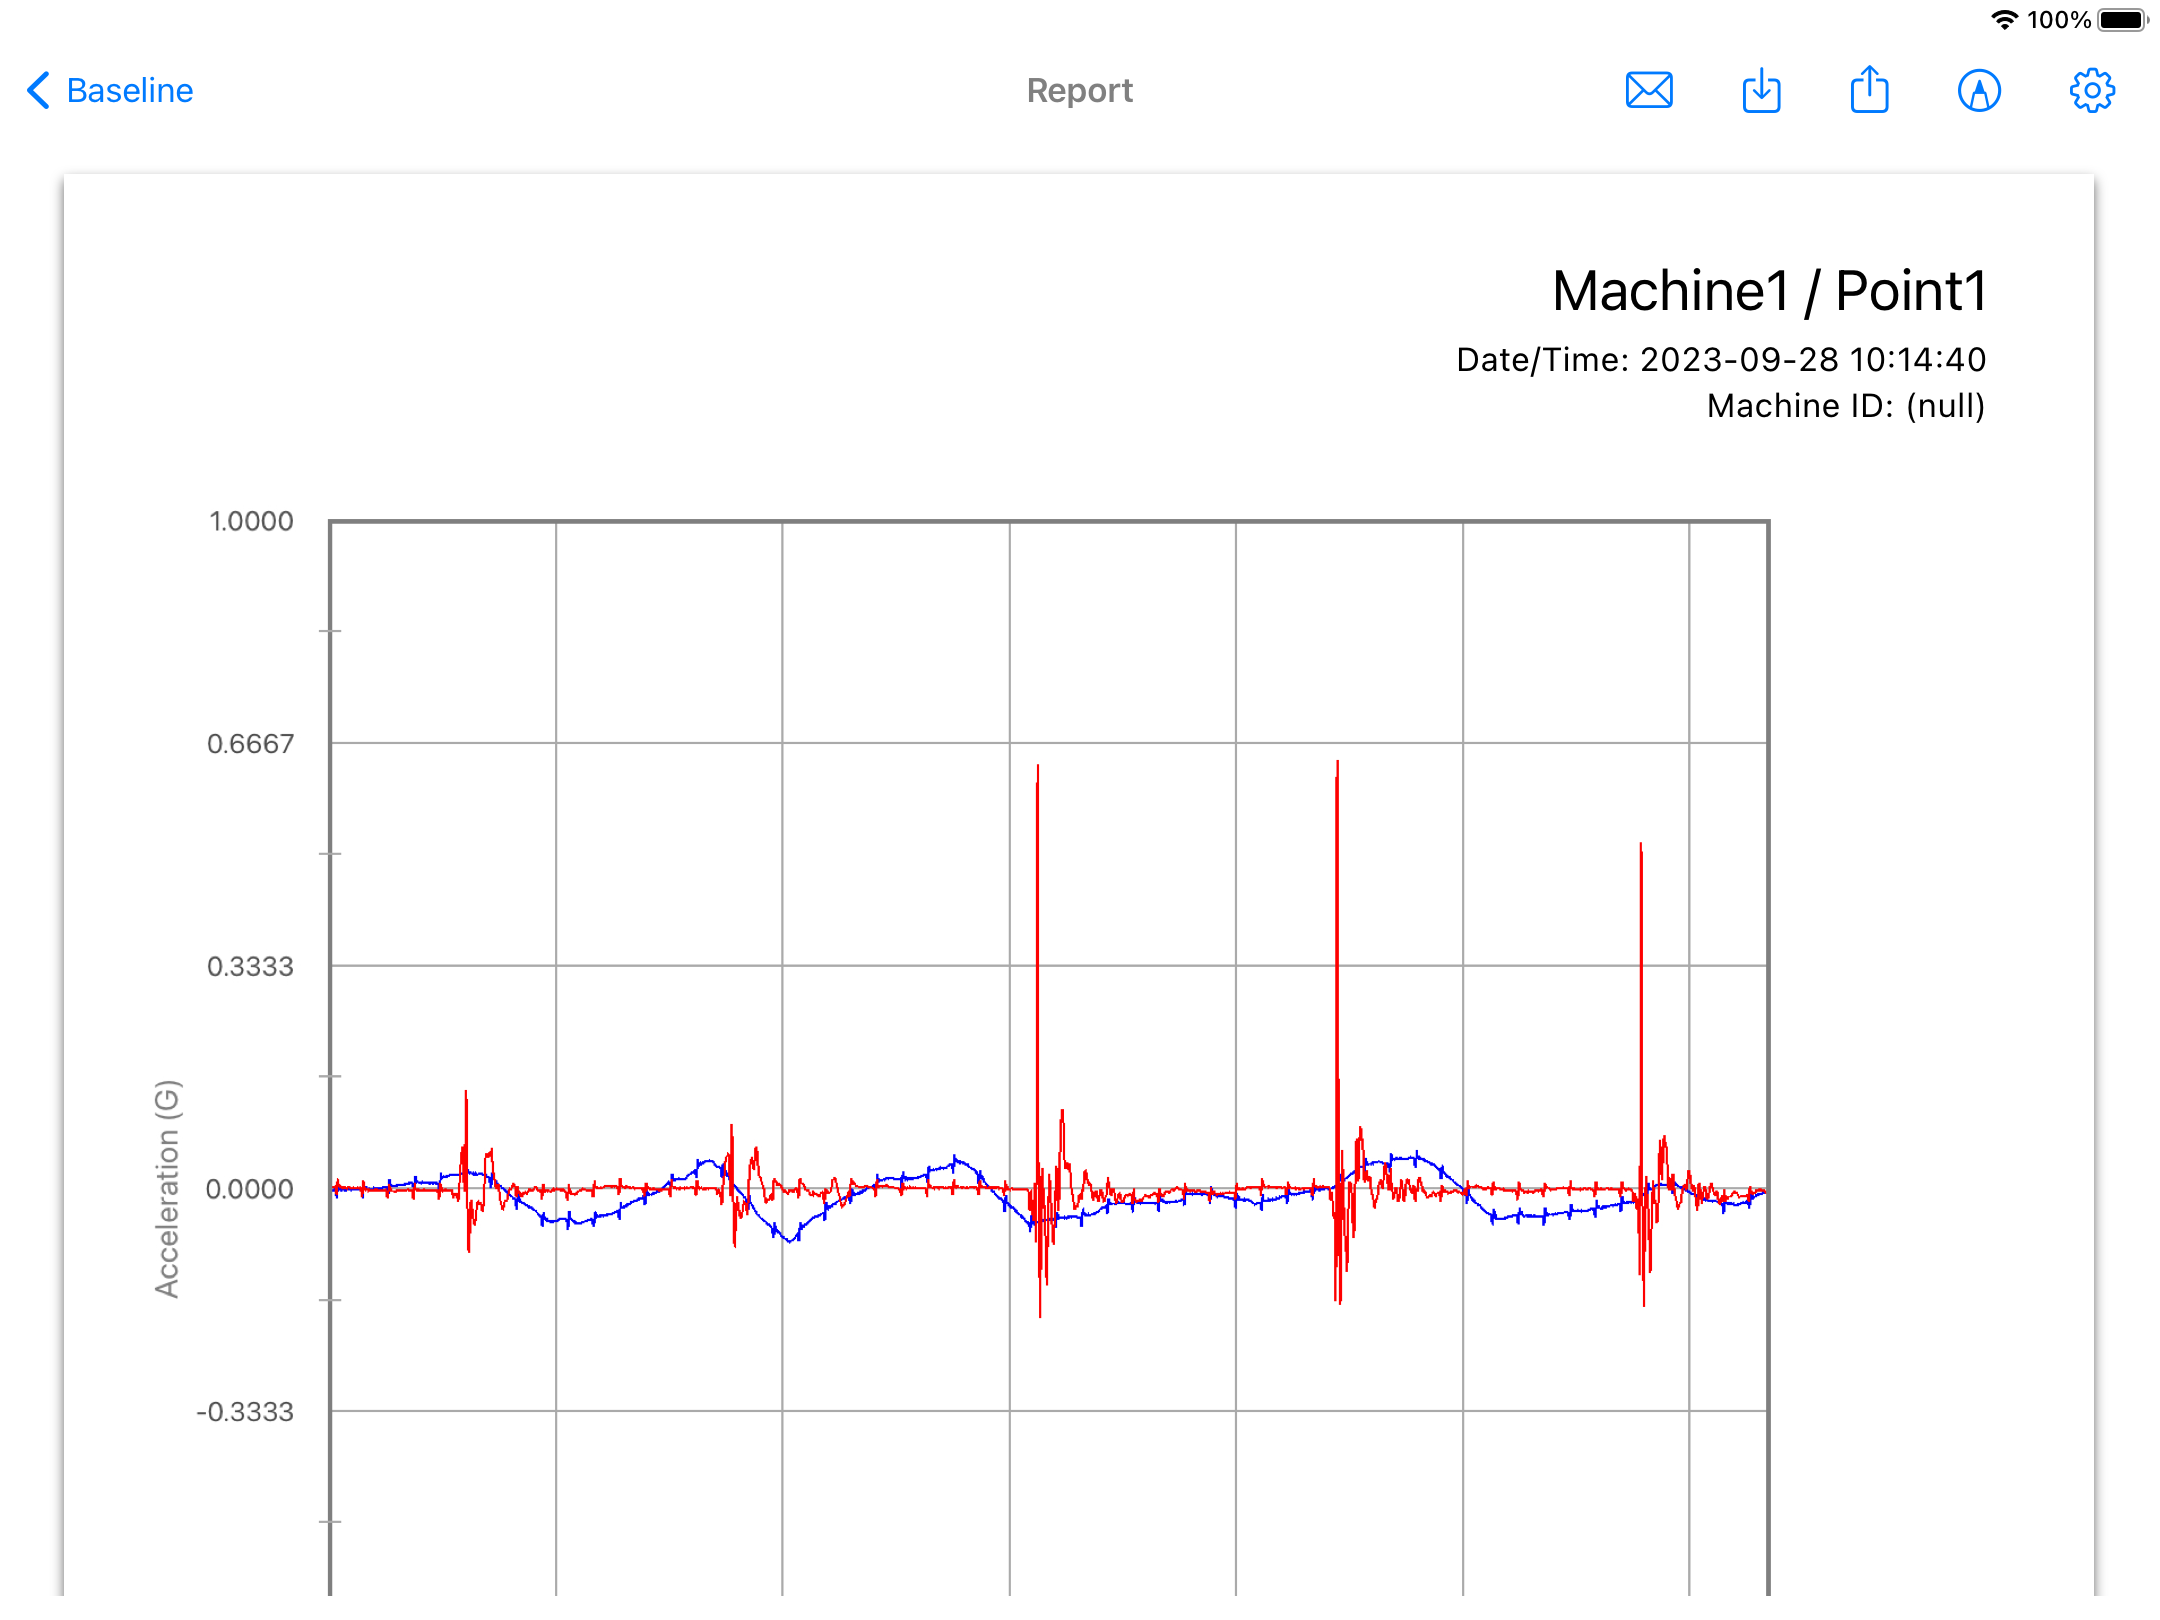
Report
- Clicking on the Report button will open a new view with the pdf report, including the plot and the machine/point name
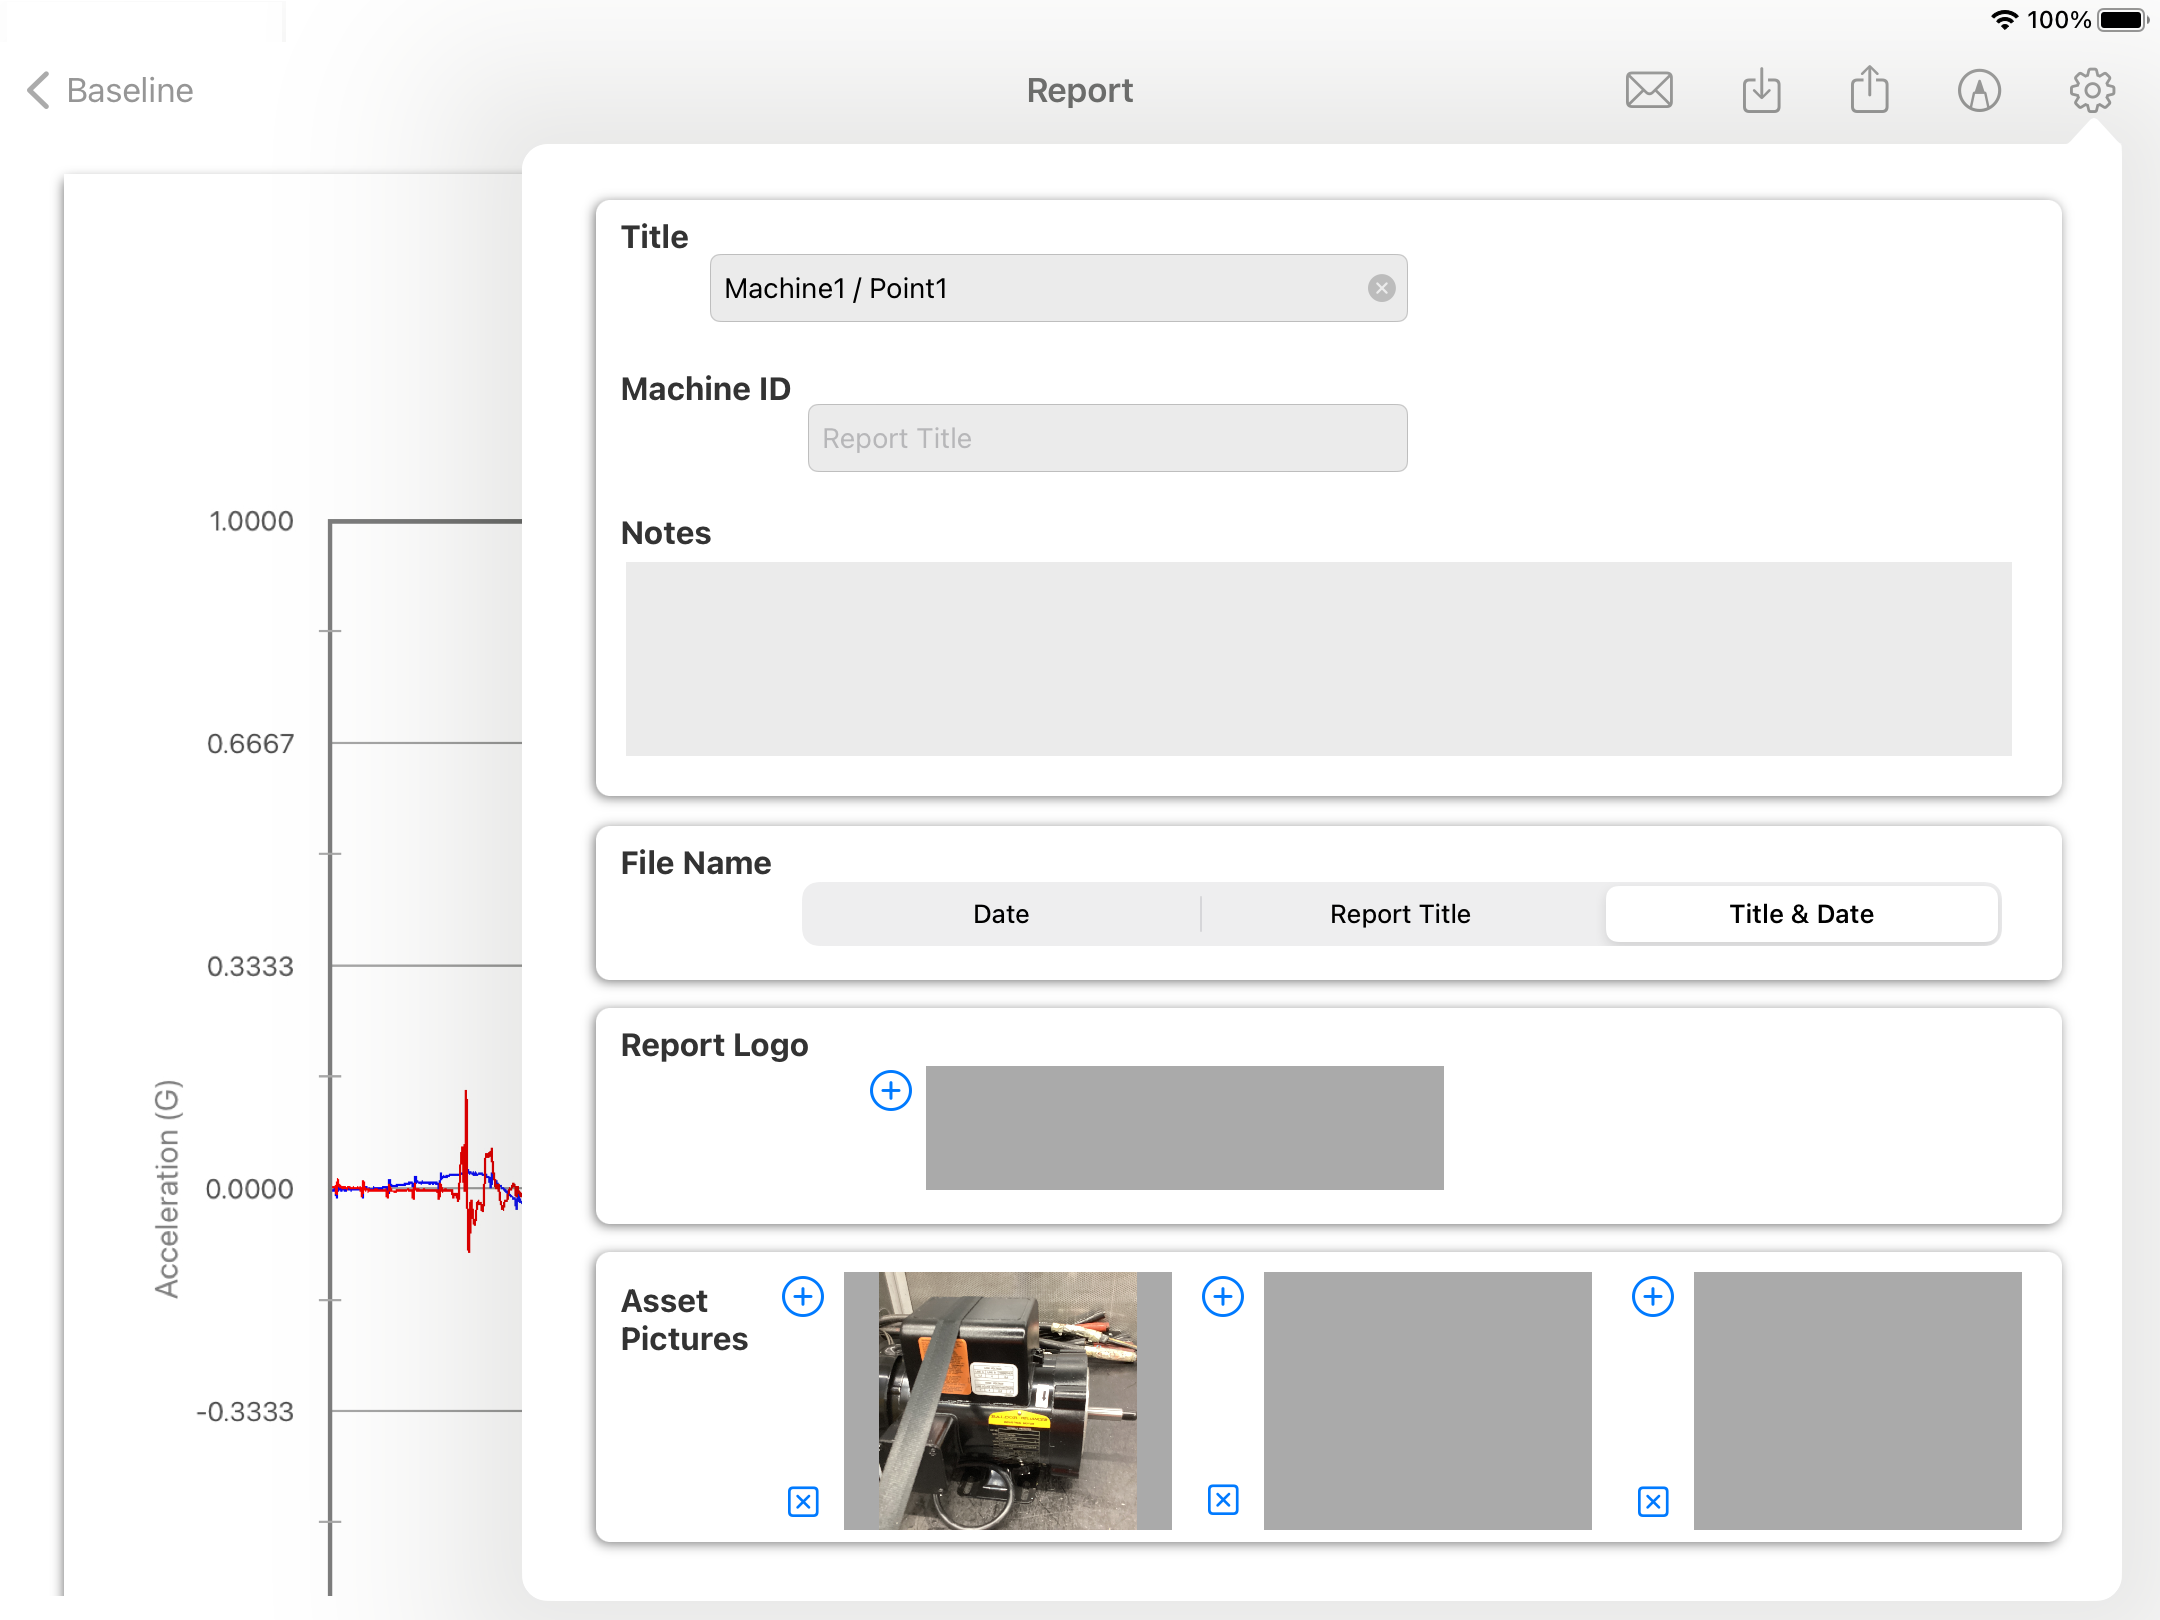
- The report view contains several options in the top bar menu: 1:Send by Email, 2:Save pdf locally, 3:Upload Report to the Cloud bucket, 4:Markup and 5:Report Configuration
- The Report Configuration pop-up allows the user to enter the Report Title, Machine ID and Notes to be added to the report. Here the user can also select a logo for the report and include a picture of the asset that will be added in a new page in the report. The report file name be default is the actual date and time, but the user can change it to the title name of the report or to both, the title name and date.
Changelog
See what's new added, changed, fixed, improved or updated in the latest versions.
Version 1.49 b.126 (21 Nov, 2022)
- Optimized Optimized for iPadOS 16
Version 1.15 b.75 (29 Sep, 2021)
- Added Compatibility with SensorWorks BluVib PVT Sensor
Version 1.11 b.70 (01 Apr, 2021)
Initial Release