Documentation
3934i Motion Test
MS-3934i: Pocket Vibration Analysis Studio iOS® version
- Version: 1.18 (b.35)
- Author: D. Bukowitz
- Created: 30 Mar, 2021
- Update: 01 Apr, 2023
If you have any questions that are beyond the scope of this document, Please feel free to email via info@sens-os.com
Description
The Motion test module requires an accelerometer signal from one of the supported Sensors to acquire the vibration from Shakers/Screens. The Motion Test provides a simple way for field technicians to completely characterize Shaker/Screen behavior including G force value, displacement, stroke length motion type and apect ratio. After test is complete users can create PDF reports which can be emailed or stored.
Compatibility
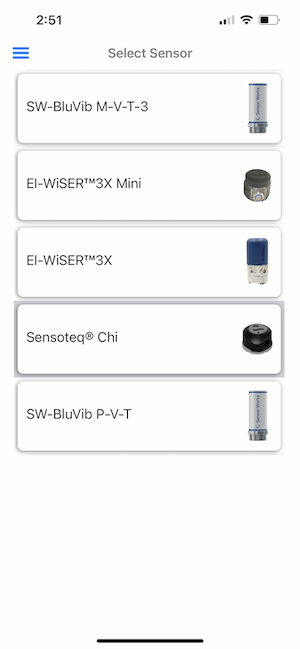
This module is compatible with the following sensors:
- Sensoteq® Chi
- Sensor-Works BluVib M-V-T-3
Main Menu
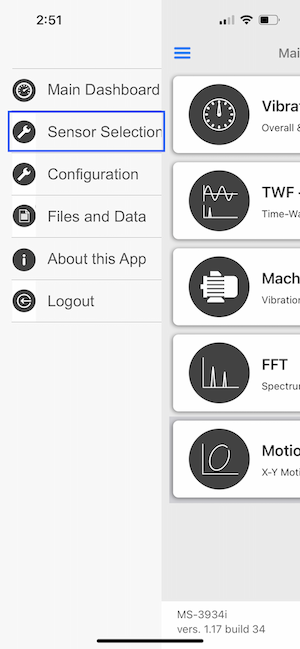
- Tap on the Sensor name button to open the list of available sensors, and select the sensor type from the list
- Scroll the list of functionalities and select Motion Test
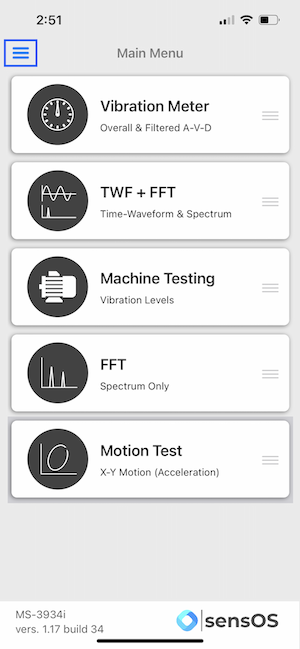
Note: The user can change the order of the functionalities in the list by dragging it from the right button on each cell
Motion Test
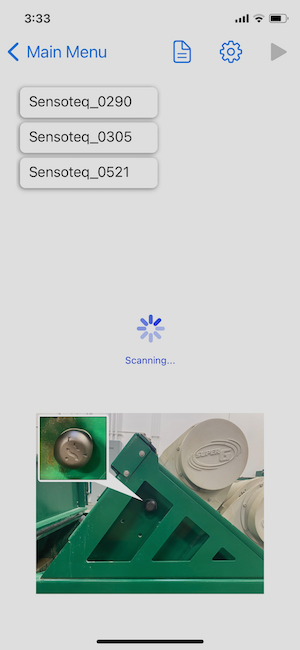
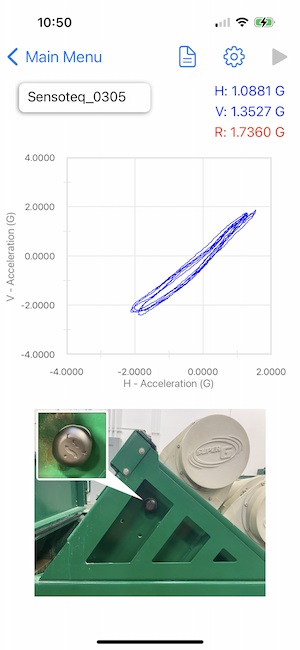
- In the Motion Test screen the Sensor Serial Number will appear in the upper left corner (this number can be confirmed by looking at its tag).
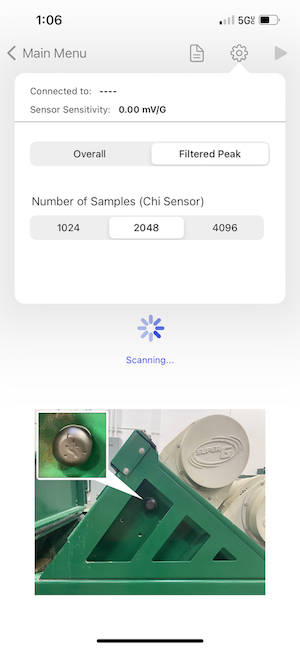
- The user can change the number of samples and switch between Overall and Filtered Peak by opening the settings pop-up. To remove high-frequency noise produced by other machine components, select the "Low-Pass" filter option or if the user needs a filtered 1X motion plot, select the 1X option. See Configuration for more details.
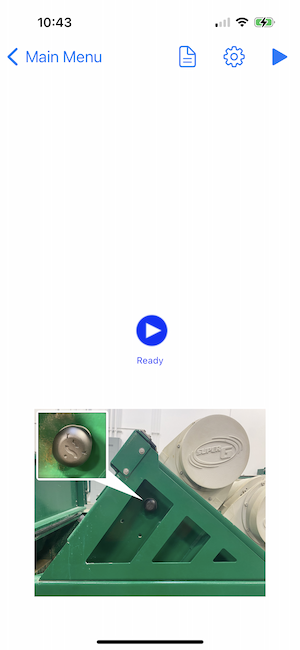
- To Activate the sensor user just needs to tap on the sensor label, the picture shows the proper sensor placement (Y Axis Pointing Up). Once Selected the Sensor Number will disappear and the Start Button will show up.
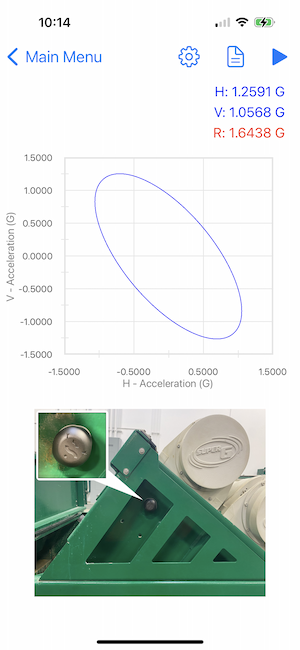
- When ready press the Start Button, the sensor will collect the data and the screen will show the orbit plot and other vibration values.
- If the Filtered 1X option was selected in the settings, the plot will show a clean 1X only motion plot.
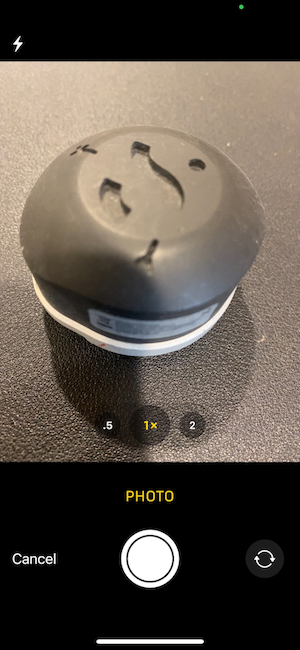
- To change the default picture with a custom photo, tap on the picture area. The camera will open and the user can take a new picture, The new pictrue will show on the screen and also in the generated Report.
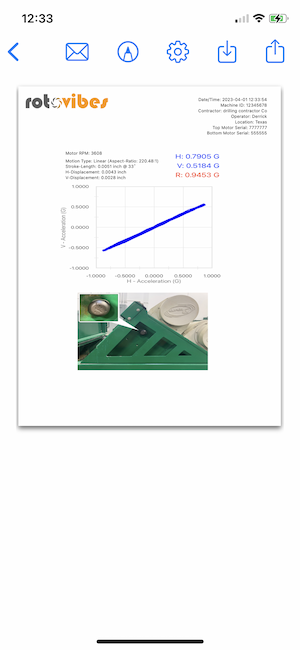
- Once test is complete user can press on the report button which will show Machine Info (which can be defined in Gear Icon on Top) and Motion Type, Stroke Length and Horizontal-Vertical Displacement and Attack Angle.
- Pdf report can be saved or sent by clicking on the report button, see more info in: Generating a pdf Report.


Configuration
- From the Motion Test Screen, click the Gear button to open Configuration and change the number of samples (1024, 2048 or 4096), switch the filter mode, and switch between Overall & Filtered Peak, Recommended and Default Values are 2048, Low-Pass Filter, and Filtered Peak respectively.
Report
- Clicking on the Report button will open a new view with the pdf report. The report view contains several options in the top bar menu: 1:Send by Email, 2:Save pdf locally, 3:Upload Report to the Cloud bucket, 4:Markup and 5:Report Configuration
- The markup tool allows the user to copy the report to the clipboard, send it by Airdrop or any other messaging app, email it, print it or saved it to Files. The markup tool will open the standard tool to paint on the pdf report.
- The Report Configuration pop-up allows the user to enter the Report Title, Machine ID and Notes to be added to the report. Here the user can also select a logo for the report. The report file name be default is the actual date and time, but the user can change it to the title name of the report or to both, the title name and date.
Changelog
See what's new added, changed, fixed, improved or updated in the latest versions.
Version 1.25 b.44 (01 May, 2024)
- Added 1X Filtered Motion Plot
Version 1.18 b.35 (01 Apr, 2023)
- Fixed Motion Plot Noise Reduction
Version 1.17 b.34 (28 Feb, 2023)
- Optimized Optimized for iPadOS 16
Version 1.02 b.7 (30 Mar, 2021)
Initial Release