Documentation
7314 Engine Load Test (Multi-Sensor)
MS-7314: Machine Acceptance Testing iPadOS® version
- Version: 1.15 (b.29)
- Author: D. Bukowitz
- Created: 06 Oct, 2021
- Update: 22 Nov, 2022
If you have any questions that are beyond the scope of this document, Please feel free to email via info@sens-os.com
Description
The Engine Load Test collects data from 5 triaxial sensors mounted in the machine under different load or operational conditions. For this test the user will define which sensor goes in each location and will start collecting data while changing load/RPM conditions on the machine. The test meets the Caterpillar Standards for Engine Commissioning Load Test.
Compatibility
This module is compatible with the following wireless sensors:
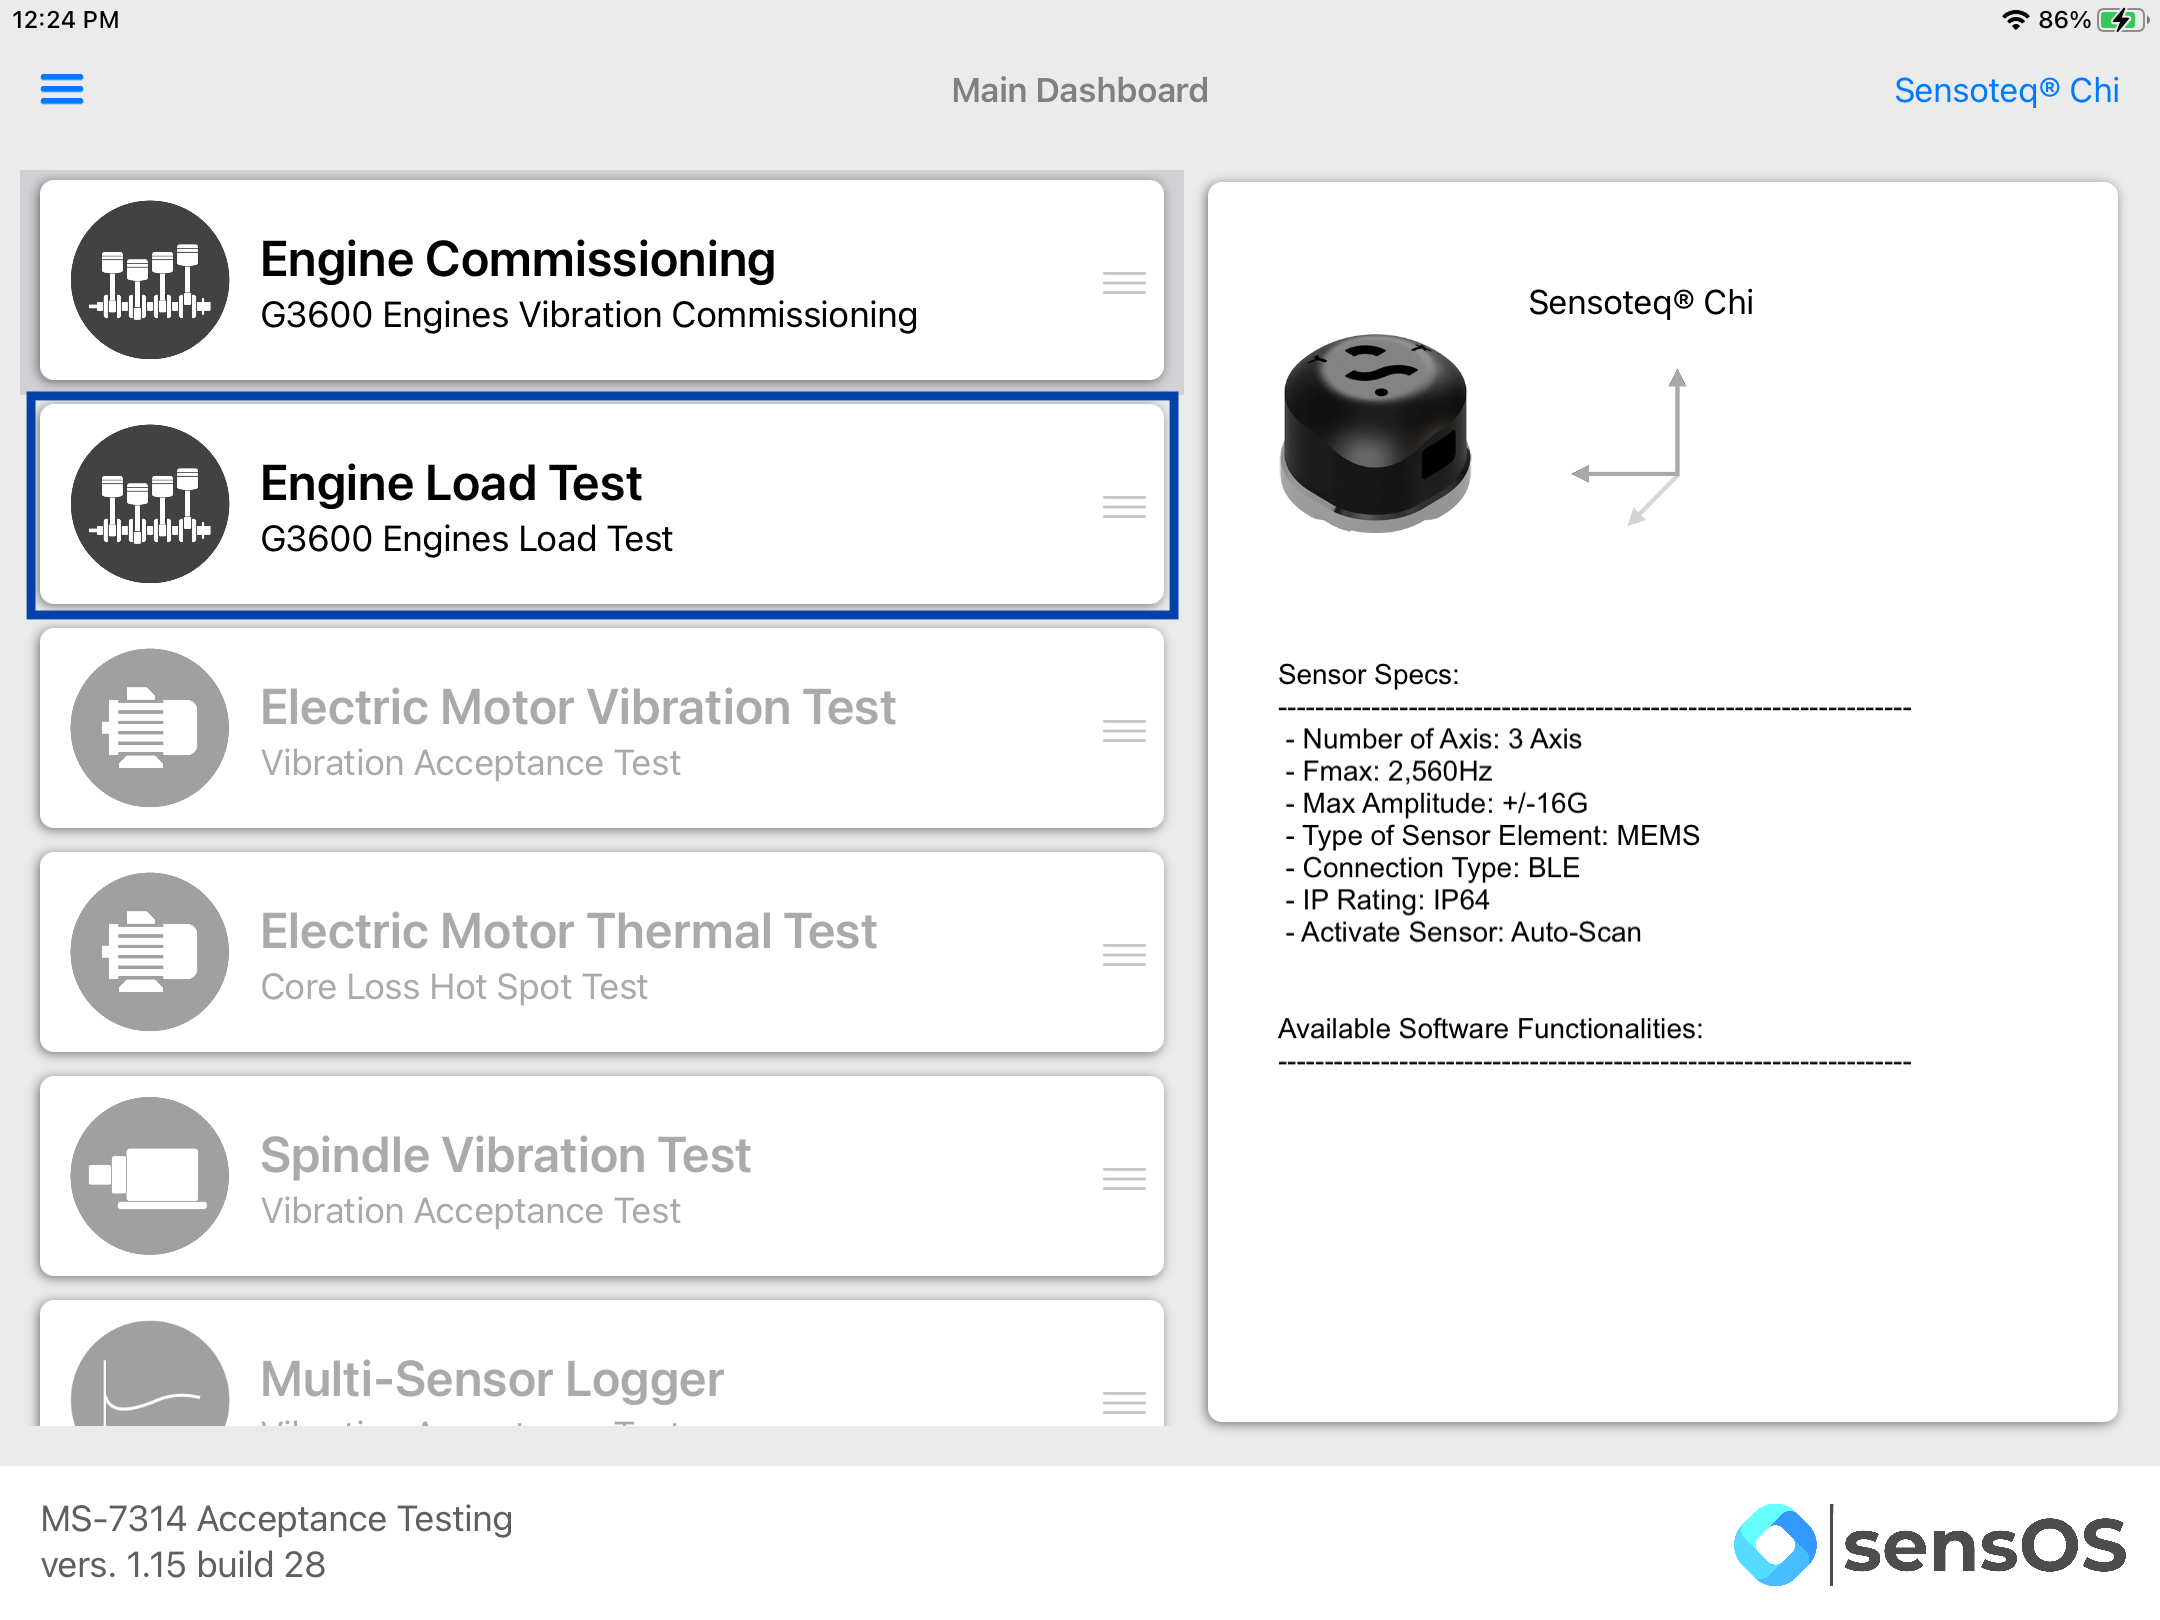
- Sensoteq® Chi (3 Axis)
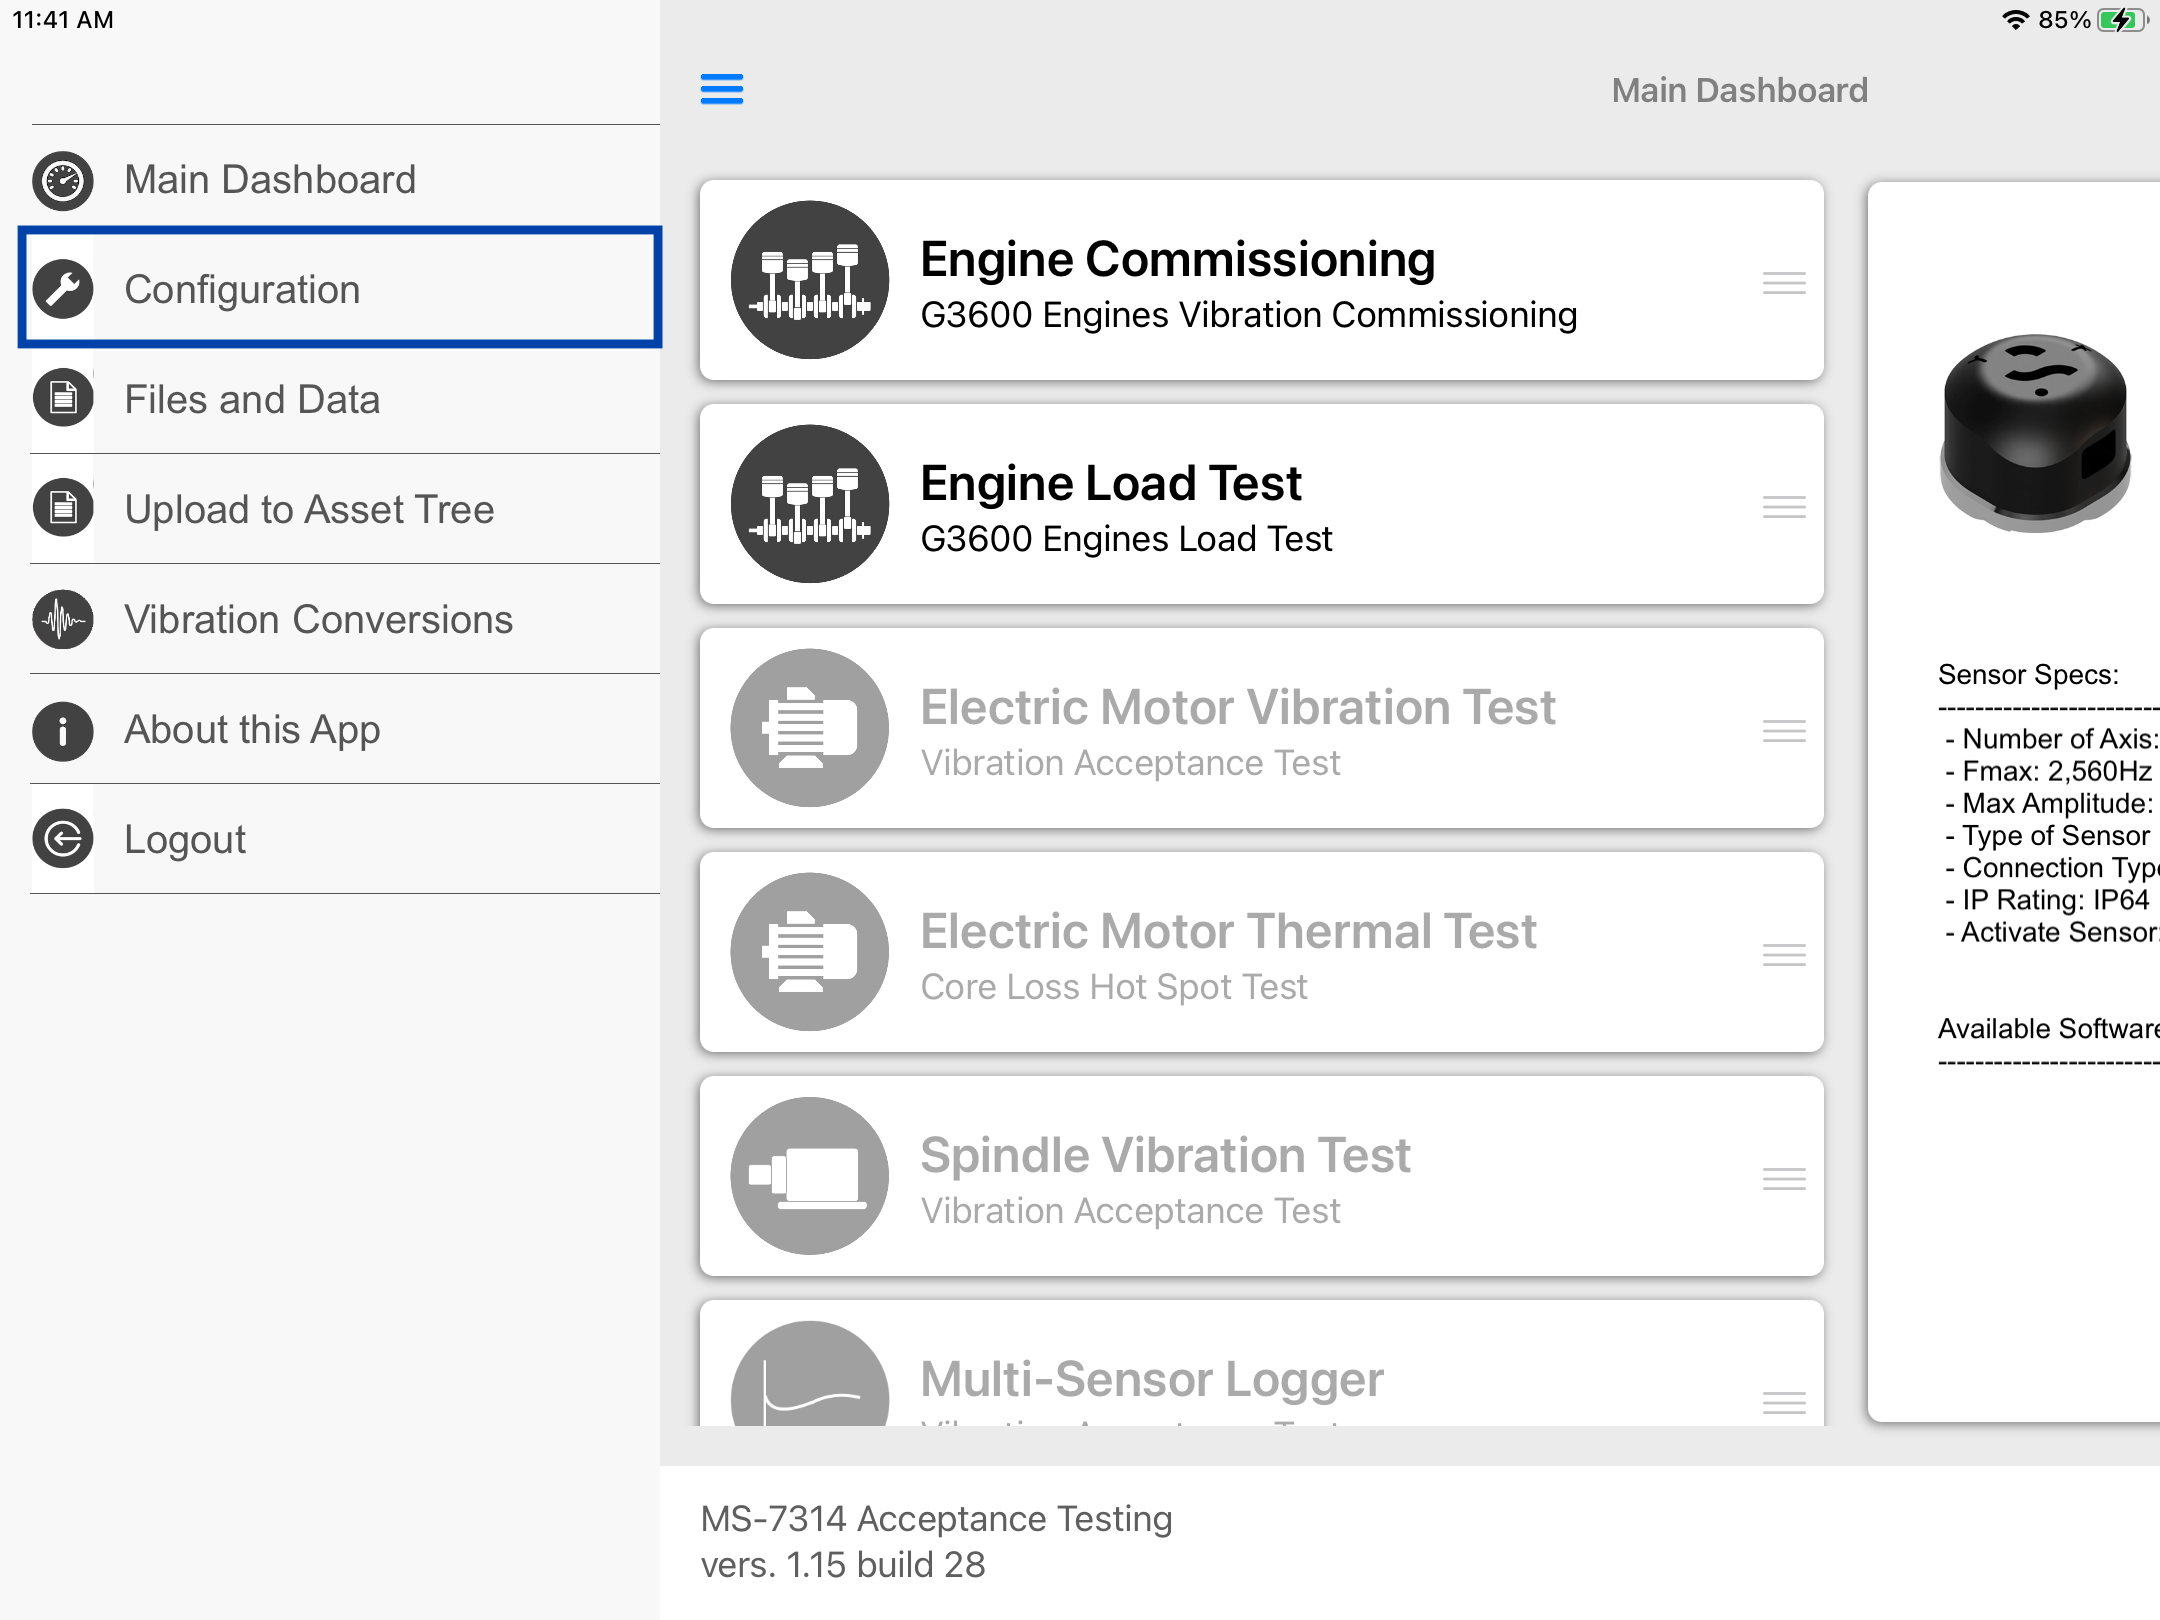
Main Menu
- Tap on the Sensor name button to open the list of available sensors, and select the thermal image camera type from the list
- Scroll the list of functionalities and select Engine Load Test.
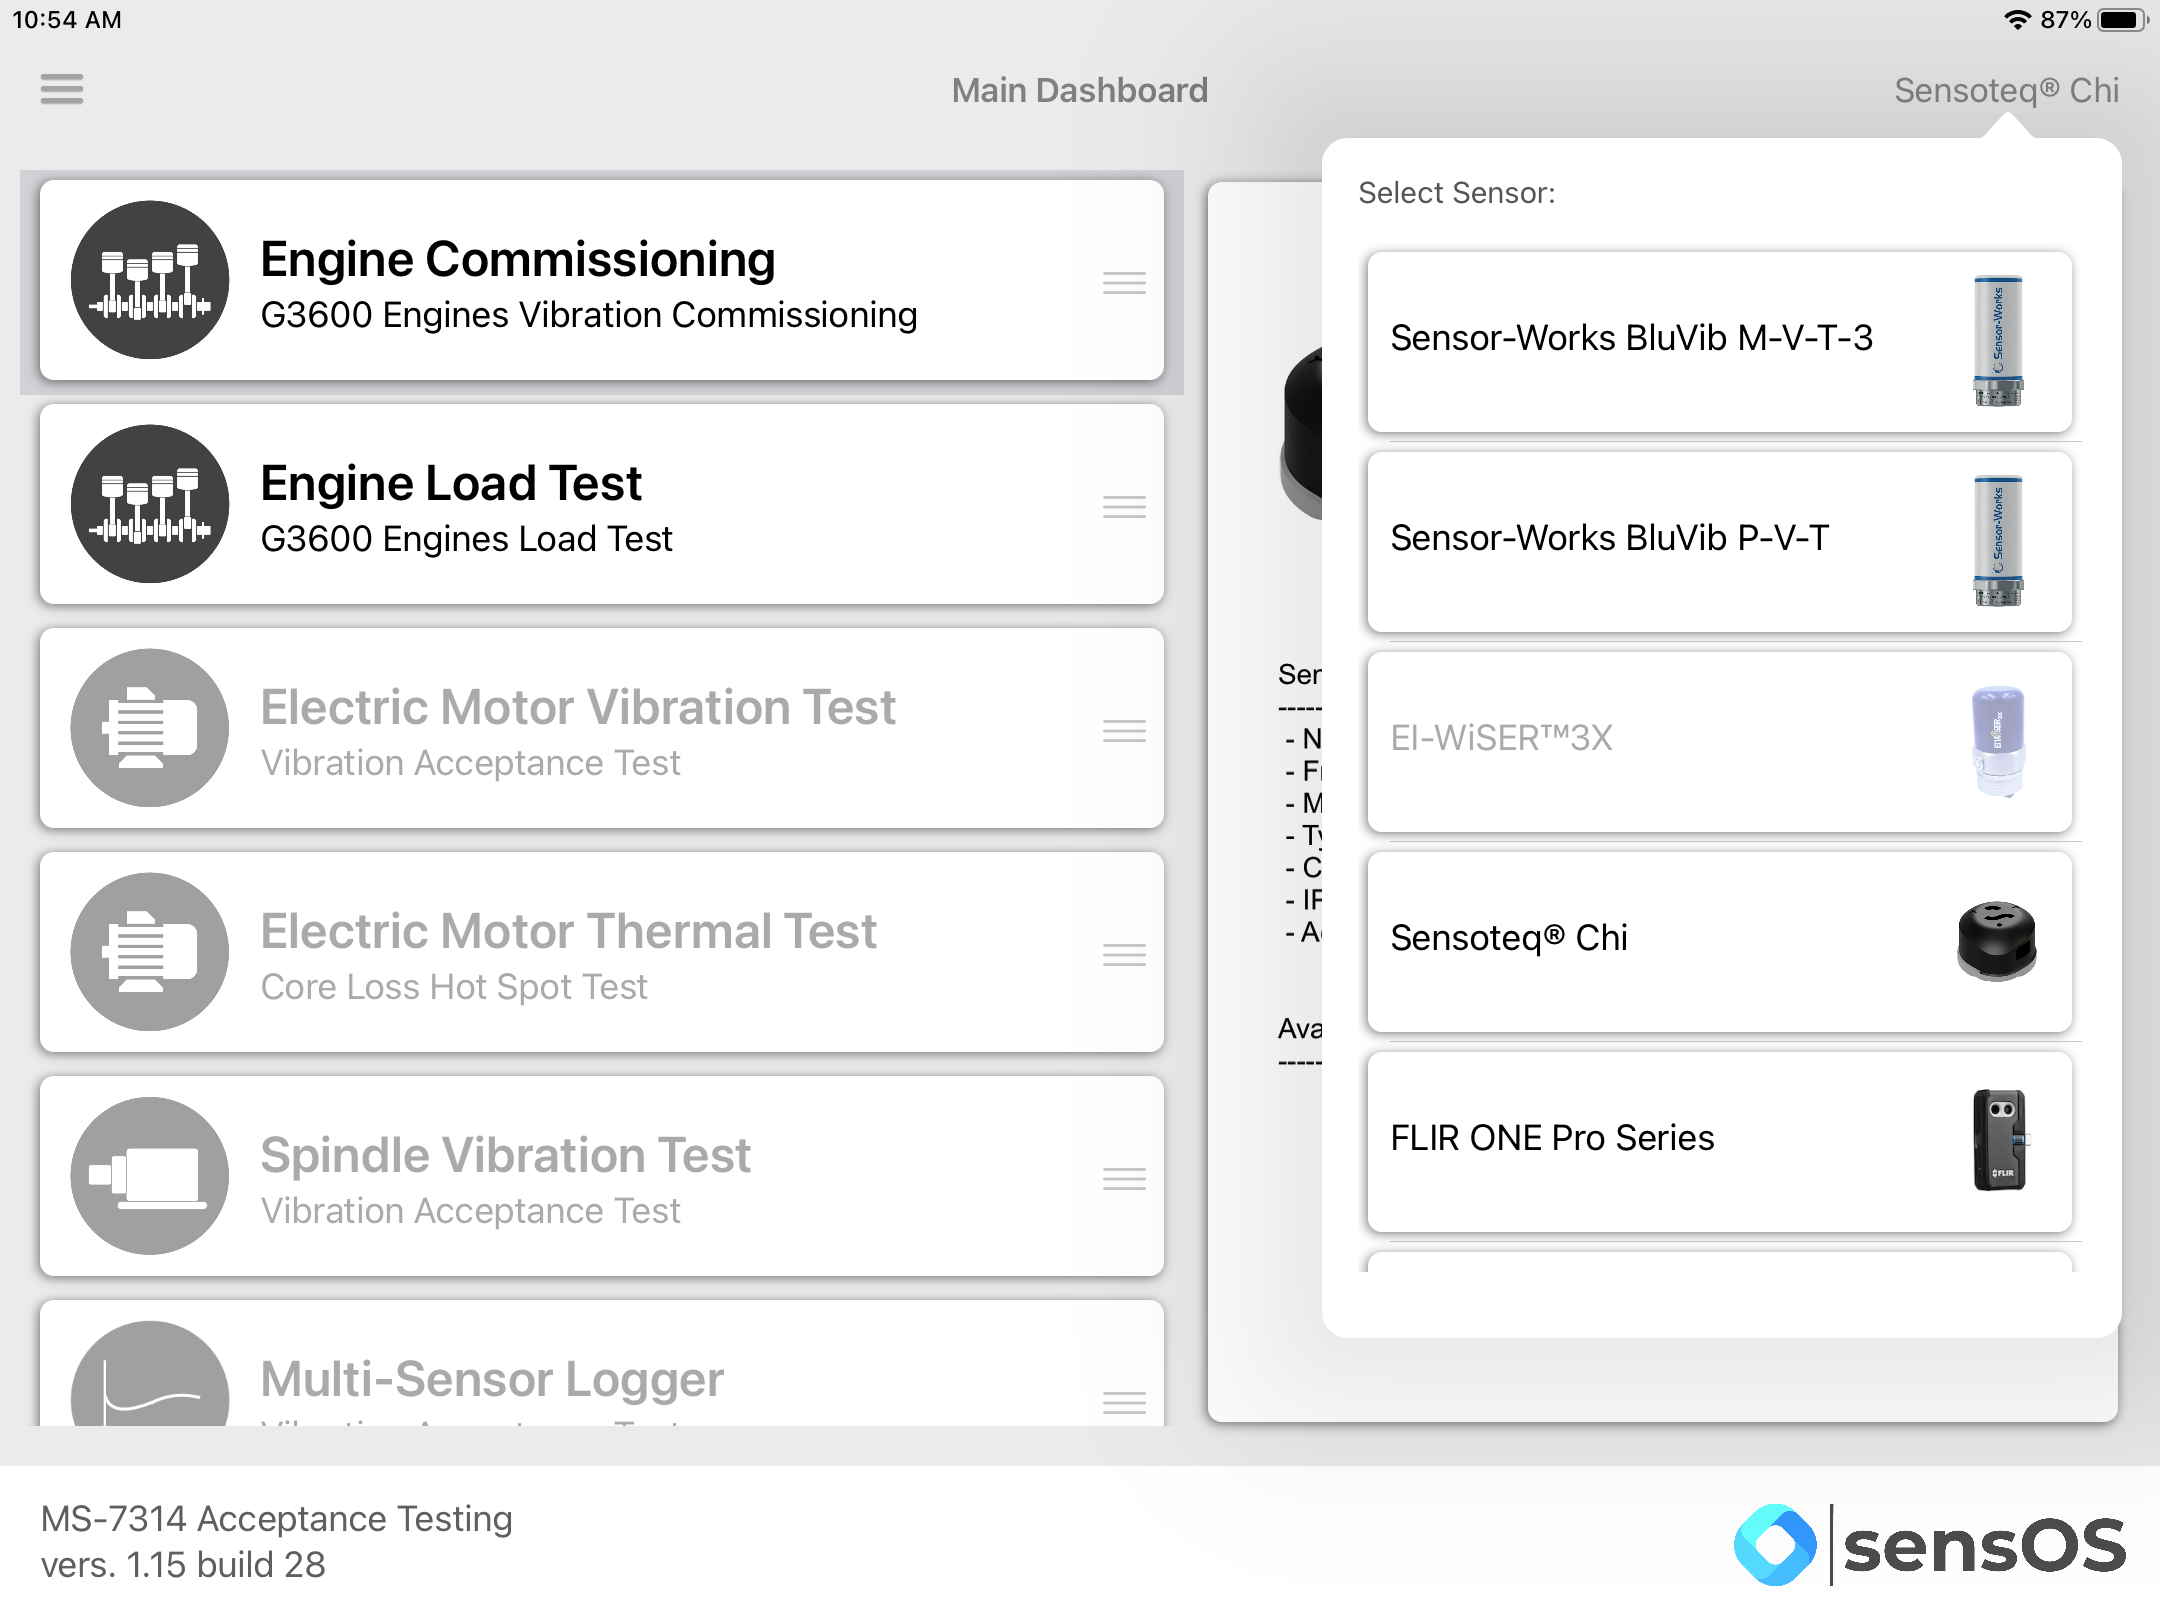
Note: The user can change the order of the functionalities in the list by dragging it from the right button on each cell
Engine Load Test
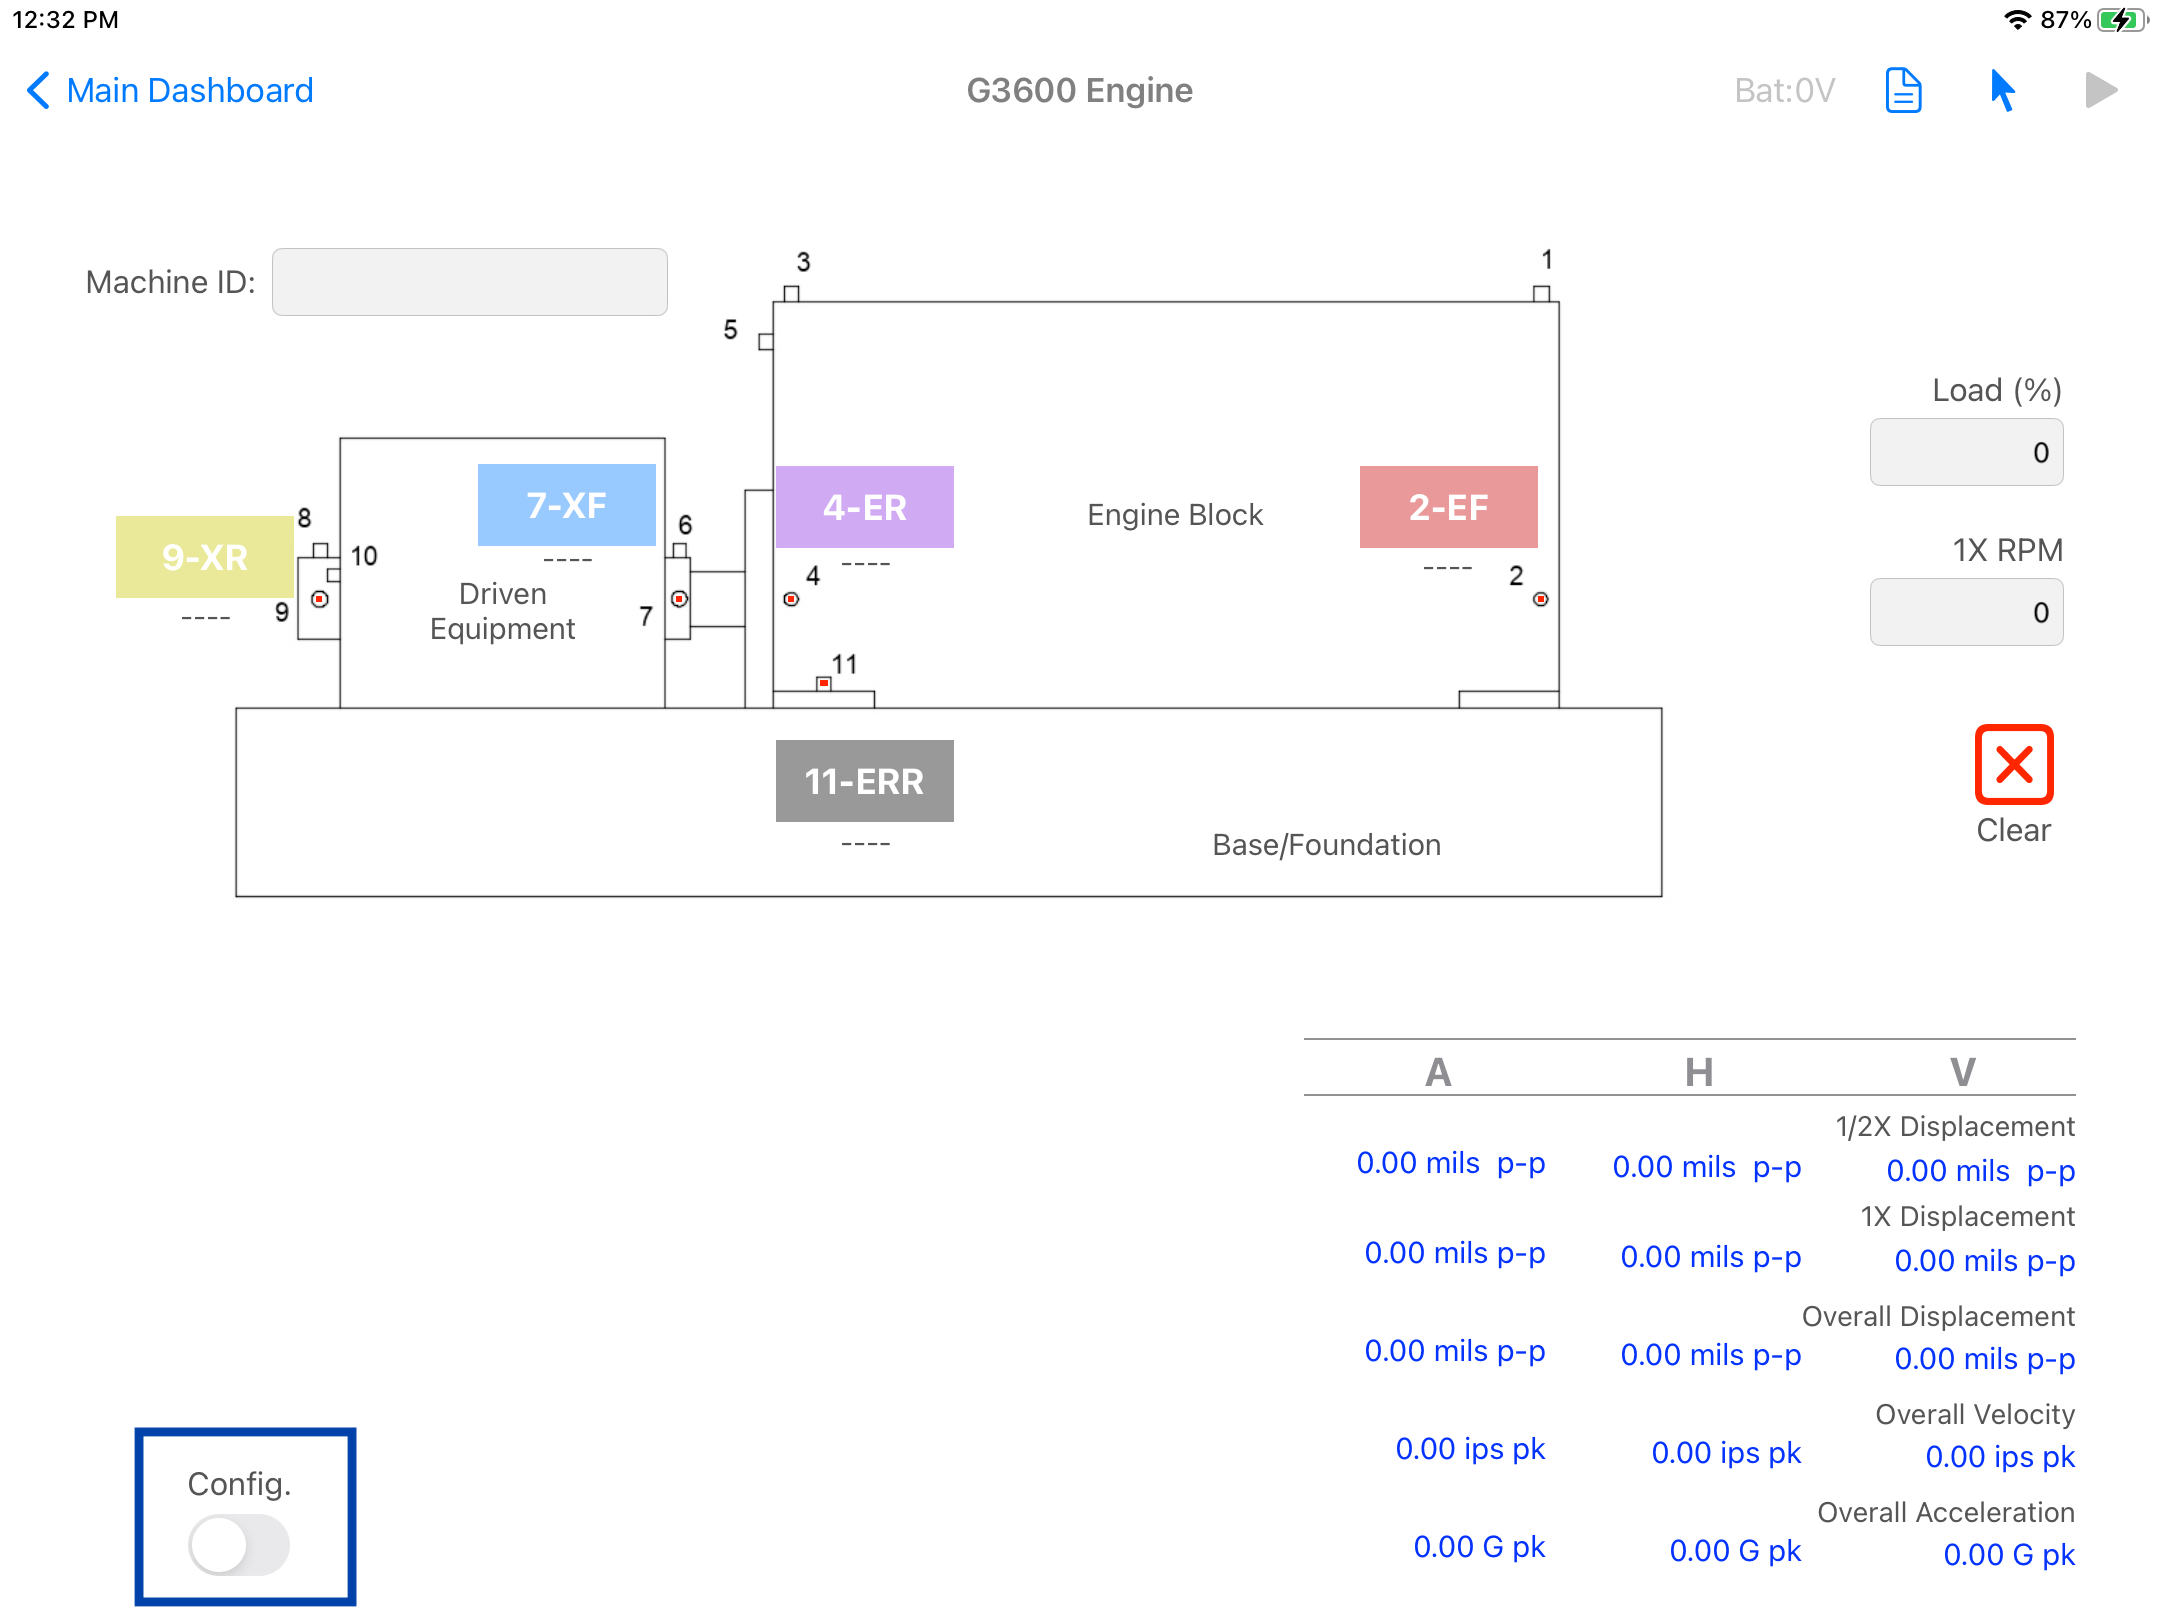
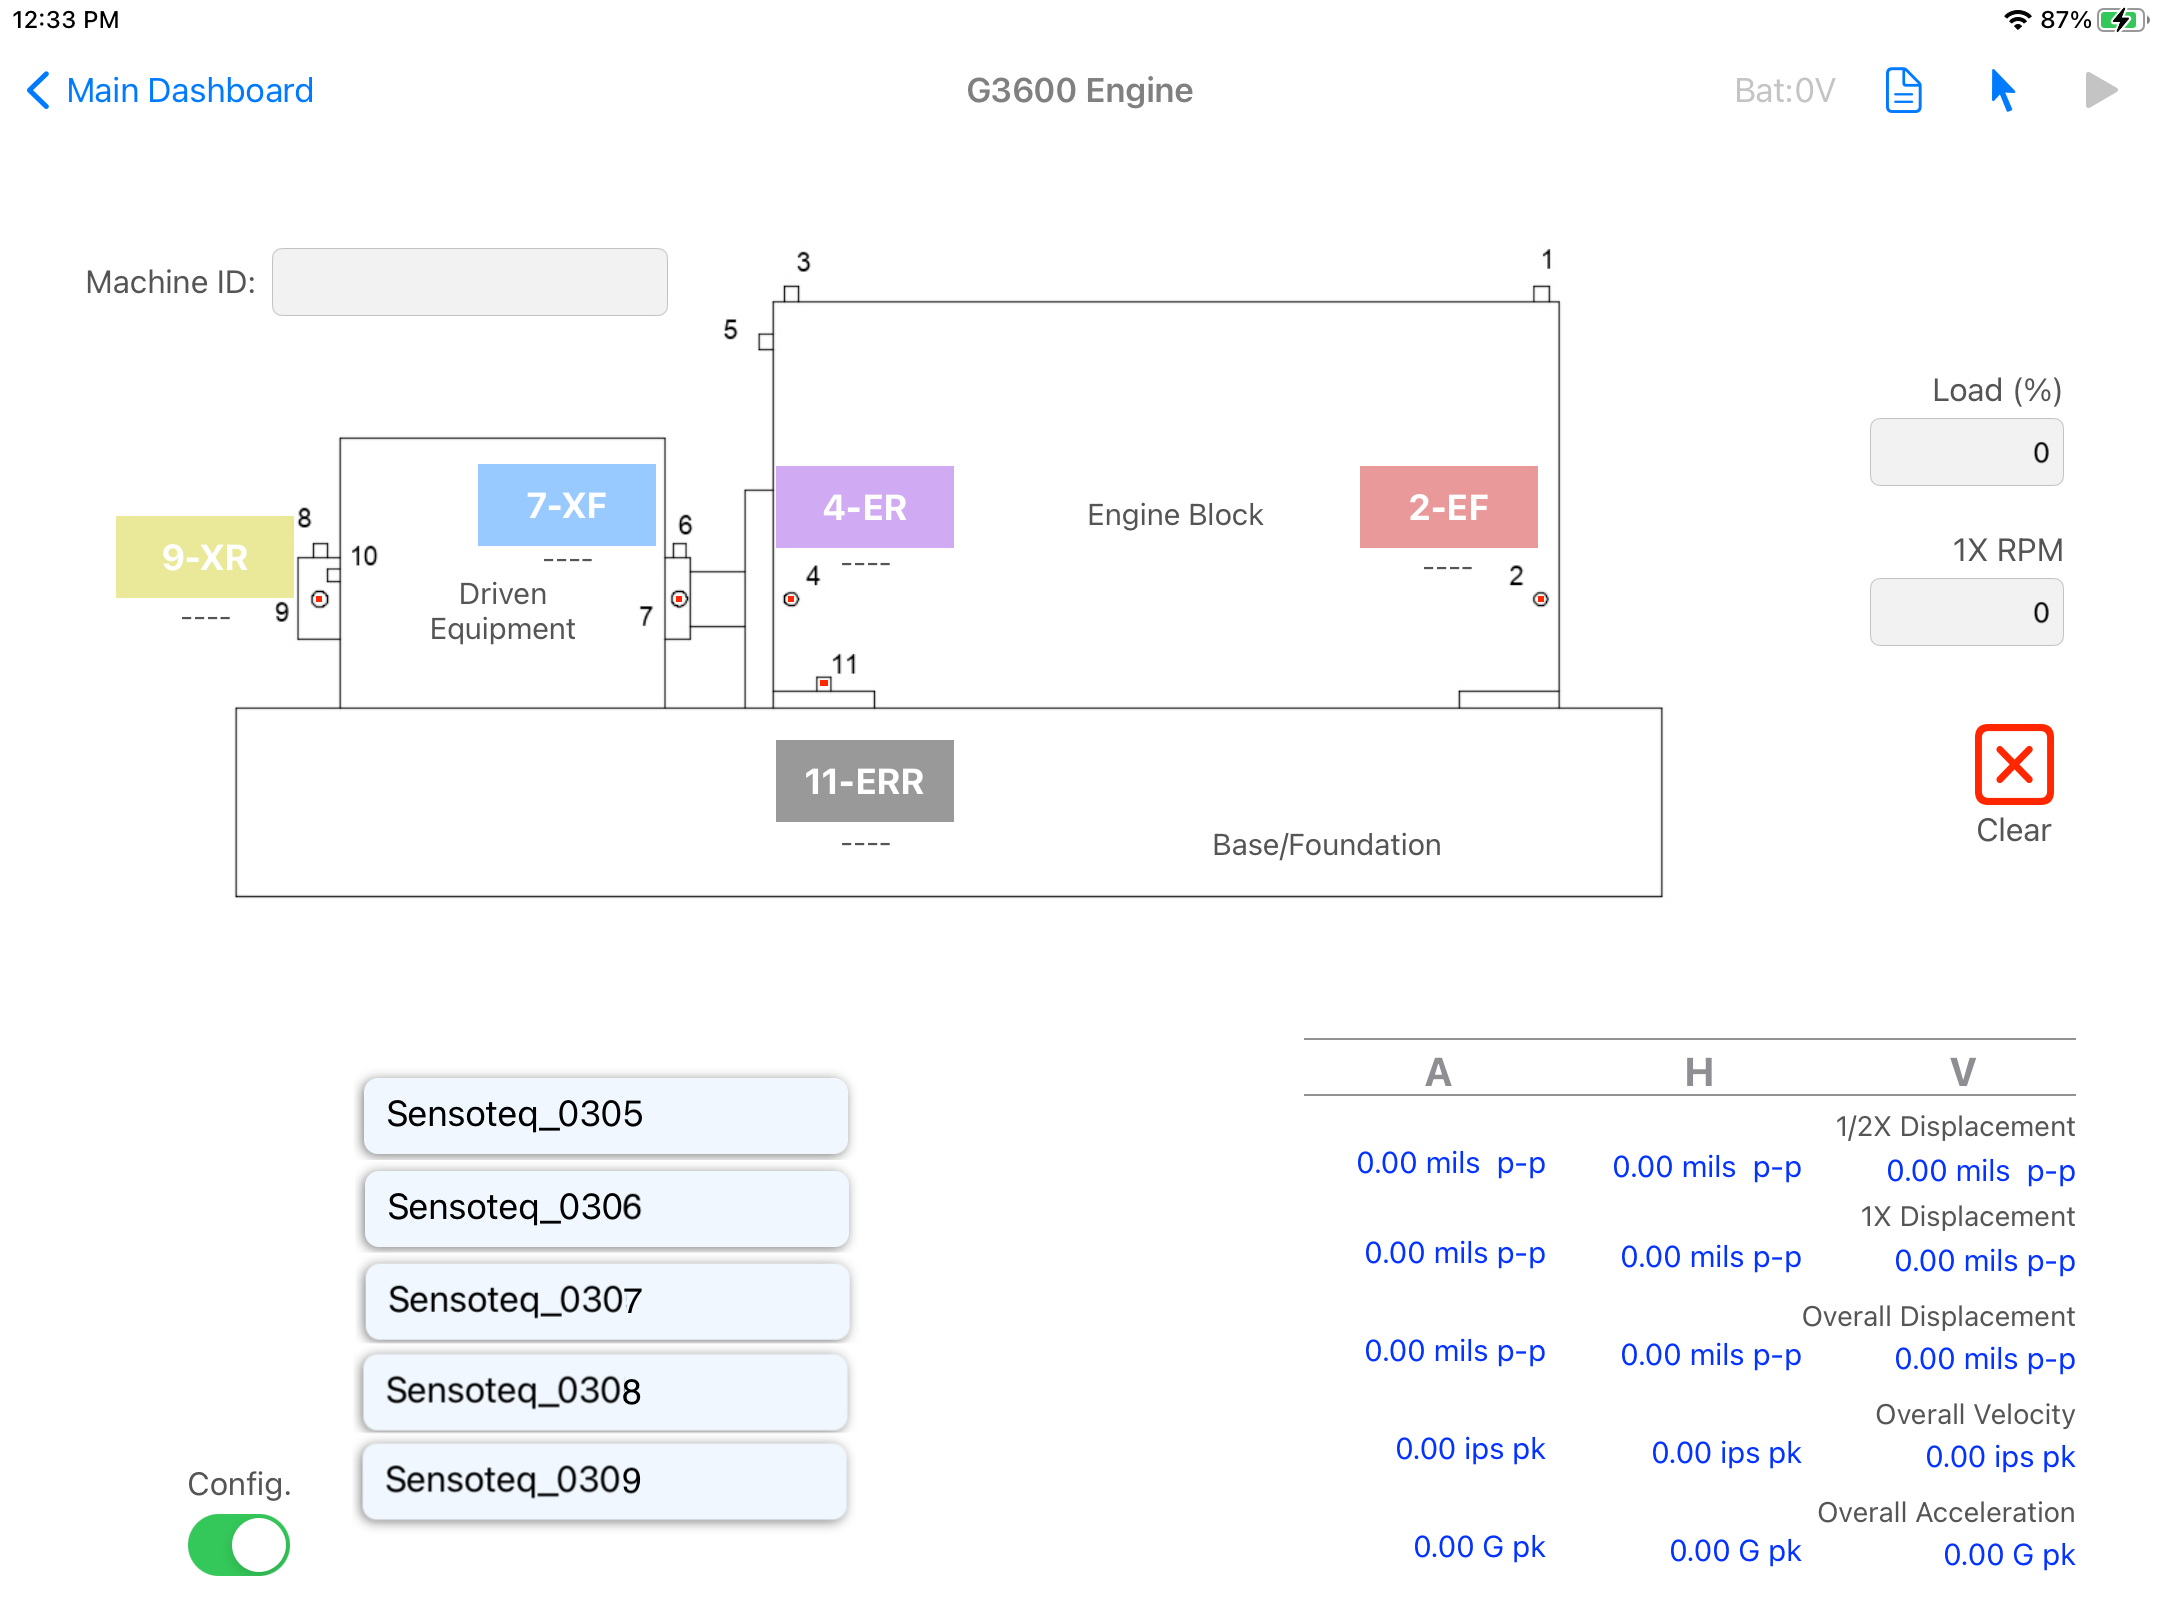
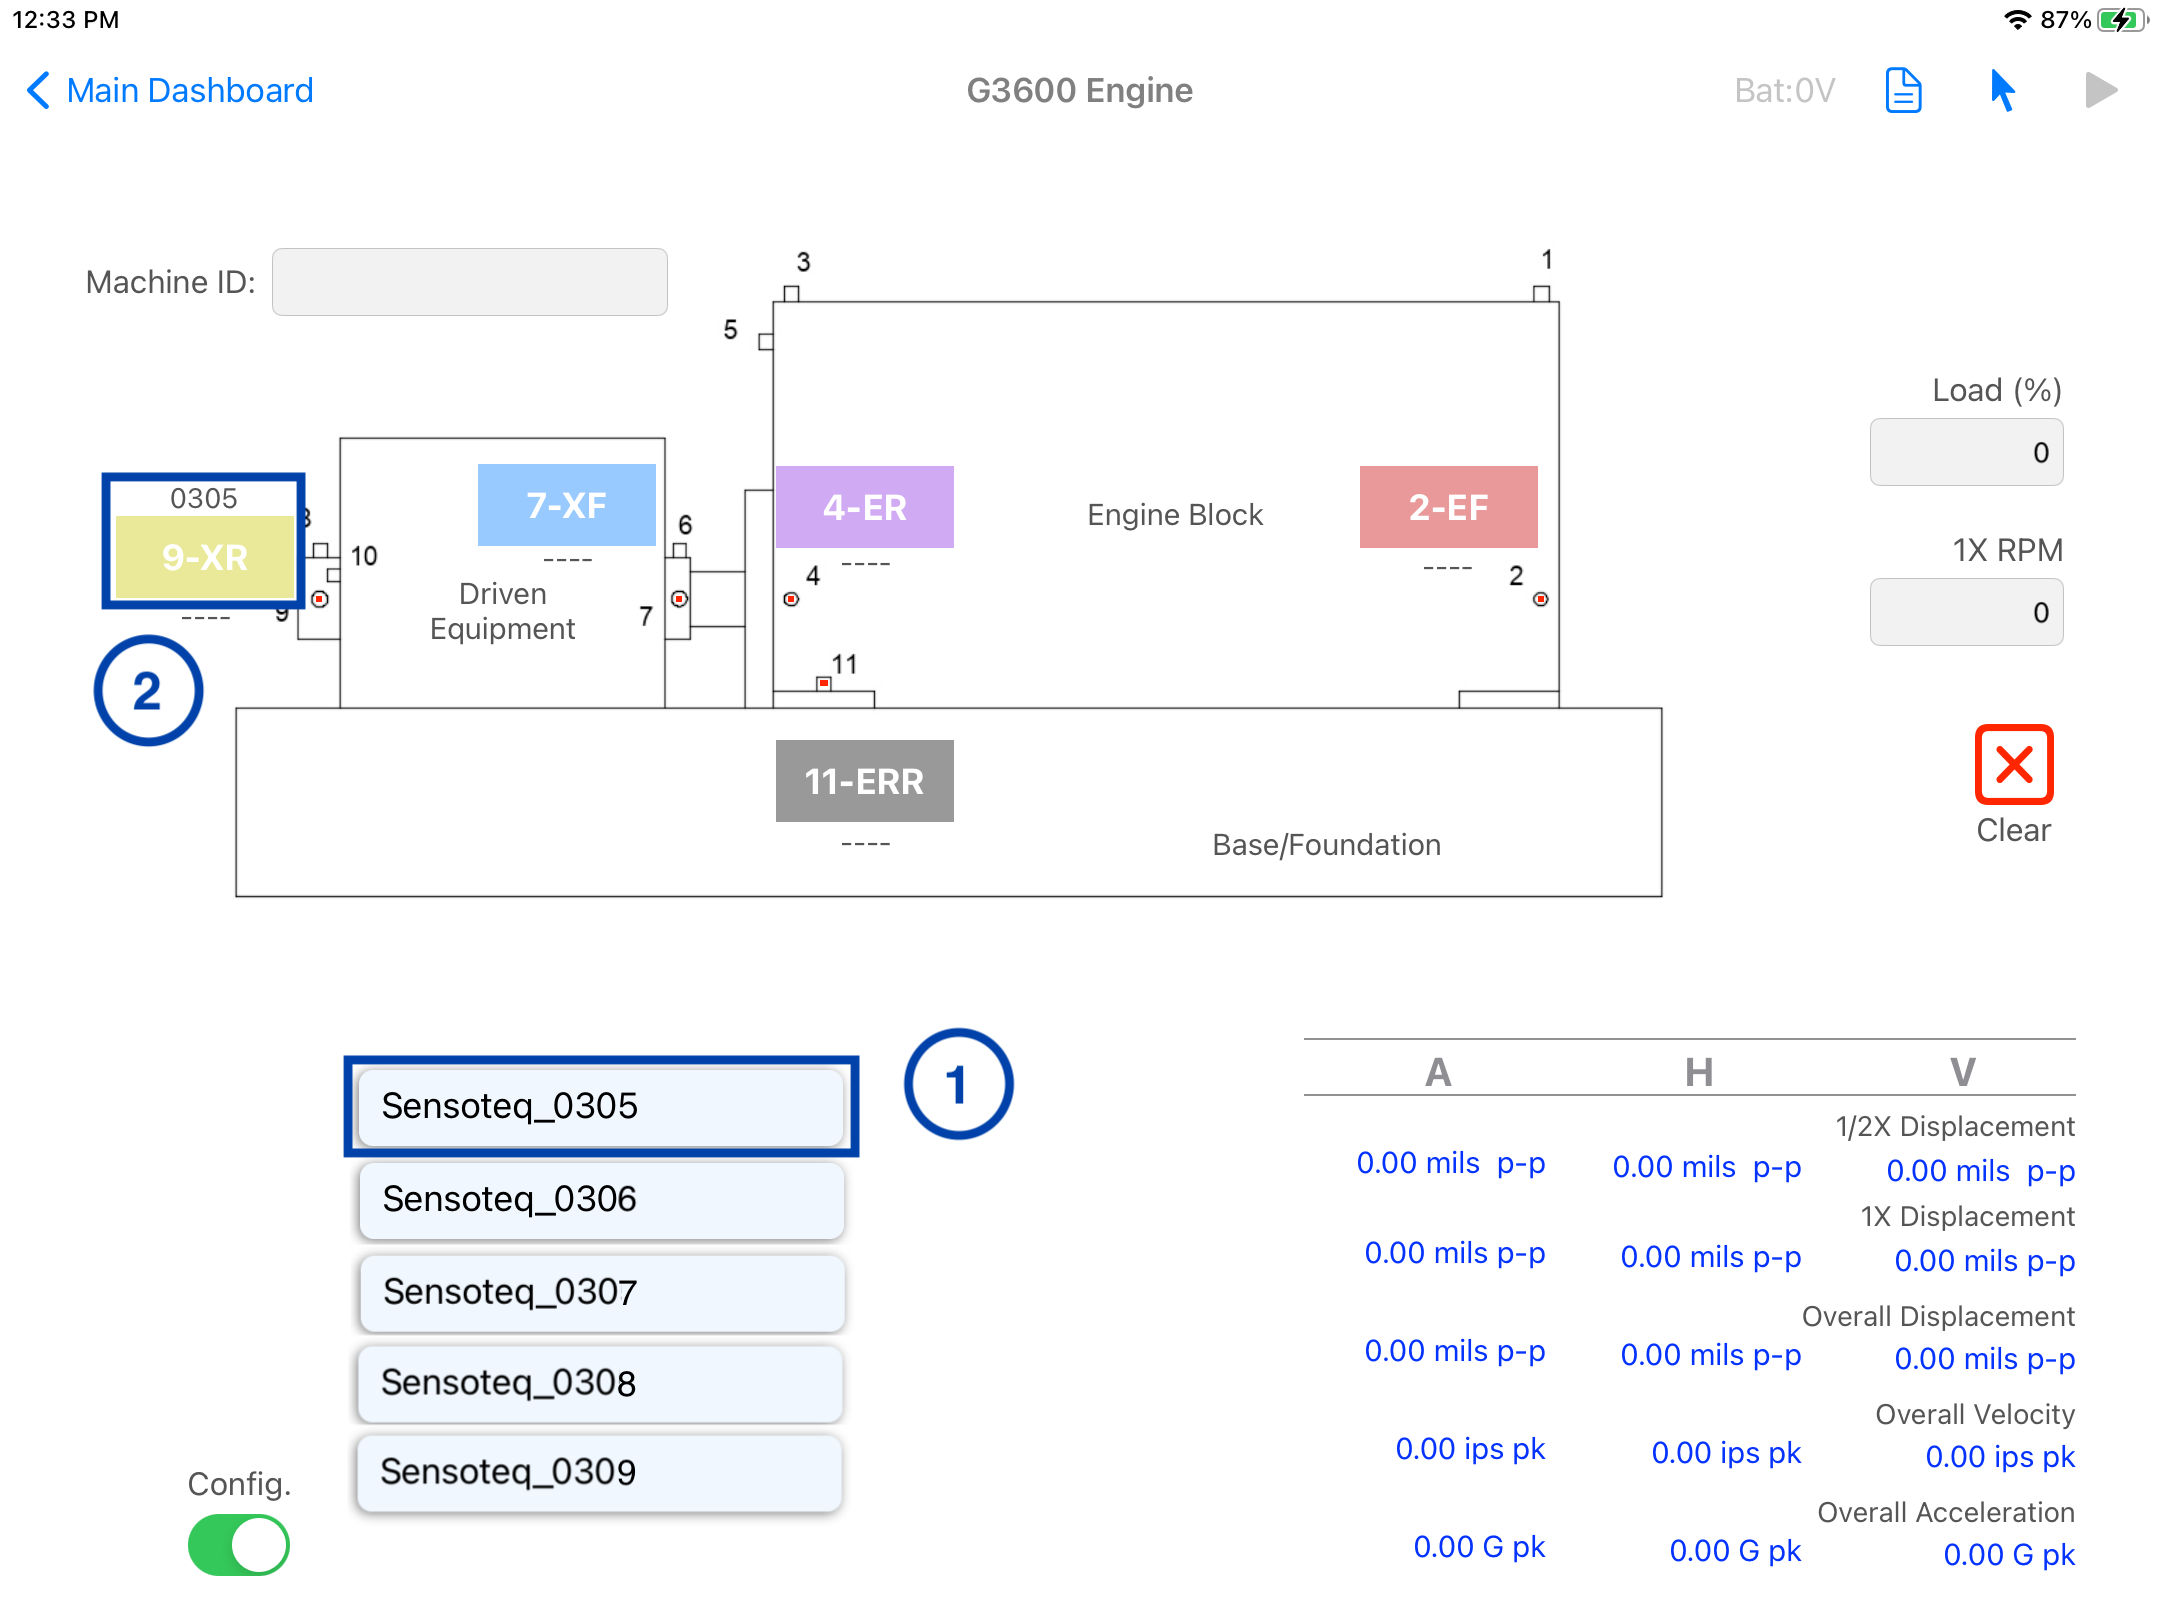
- When using the app for the first time, the user will need to asign the sensor's ID's to each location. Turn the "Config" switch to the ON position, the available wireless sensor's list will appear, as shown in the screenshot below.
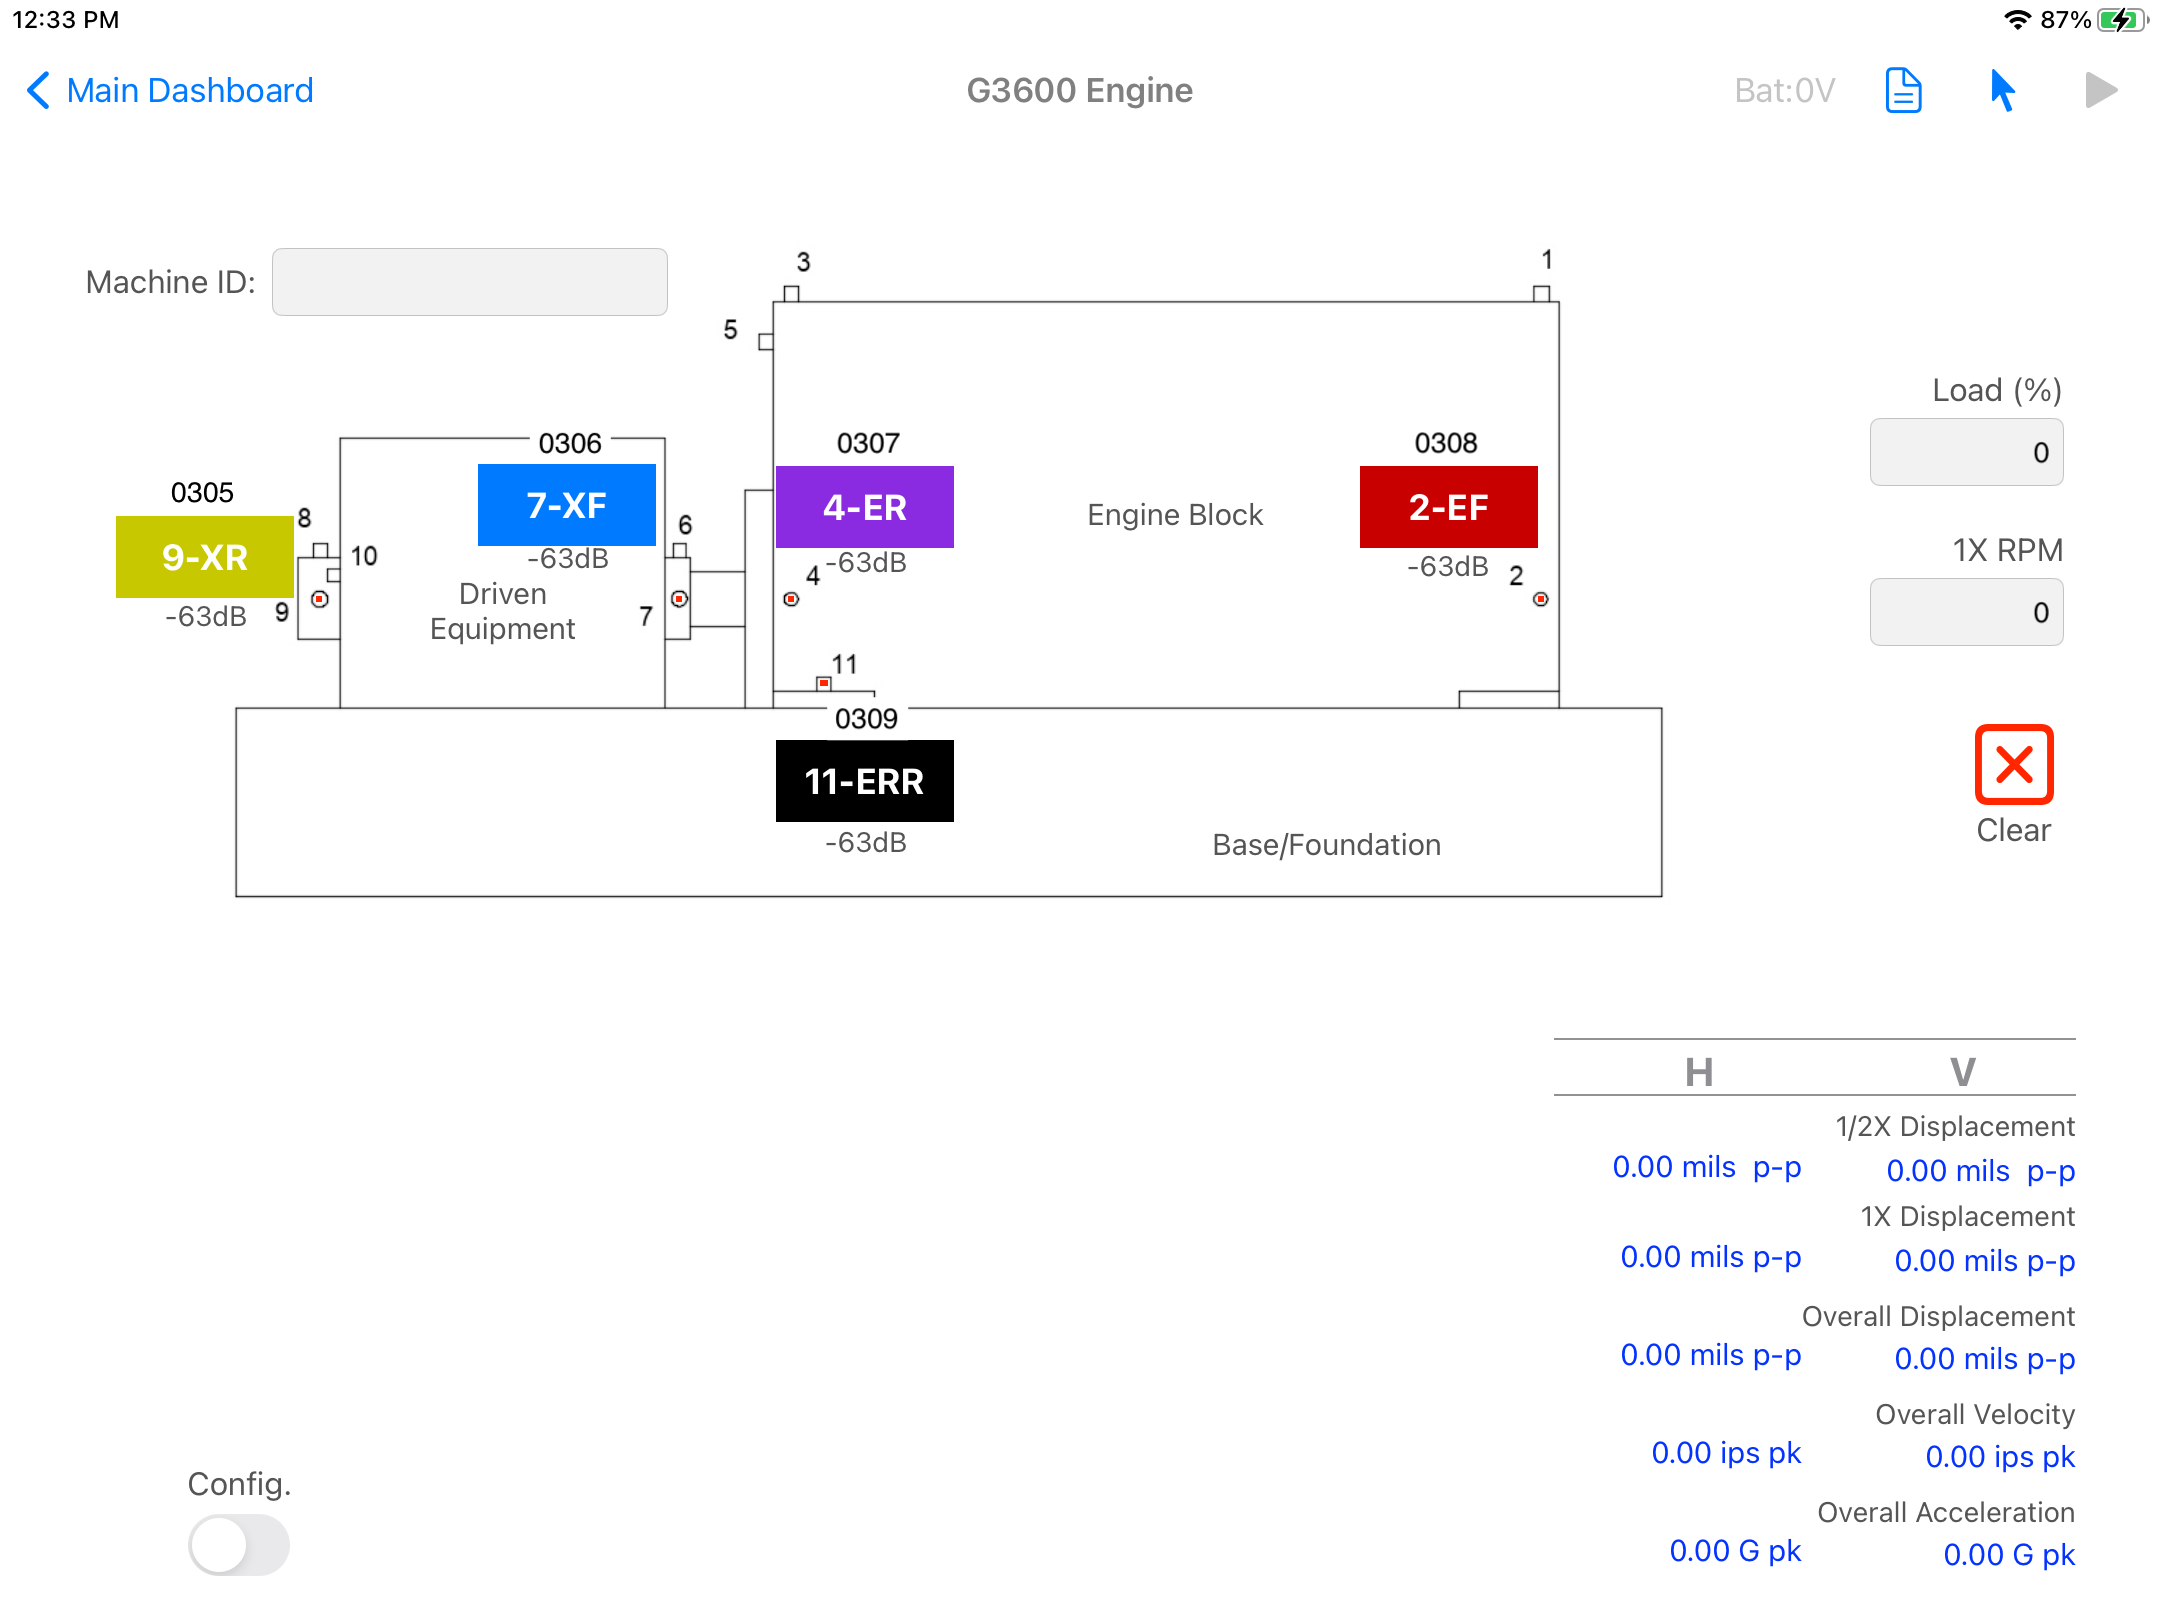
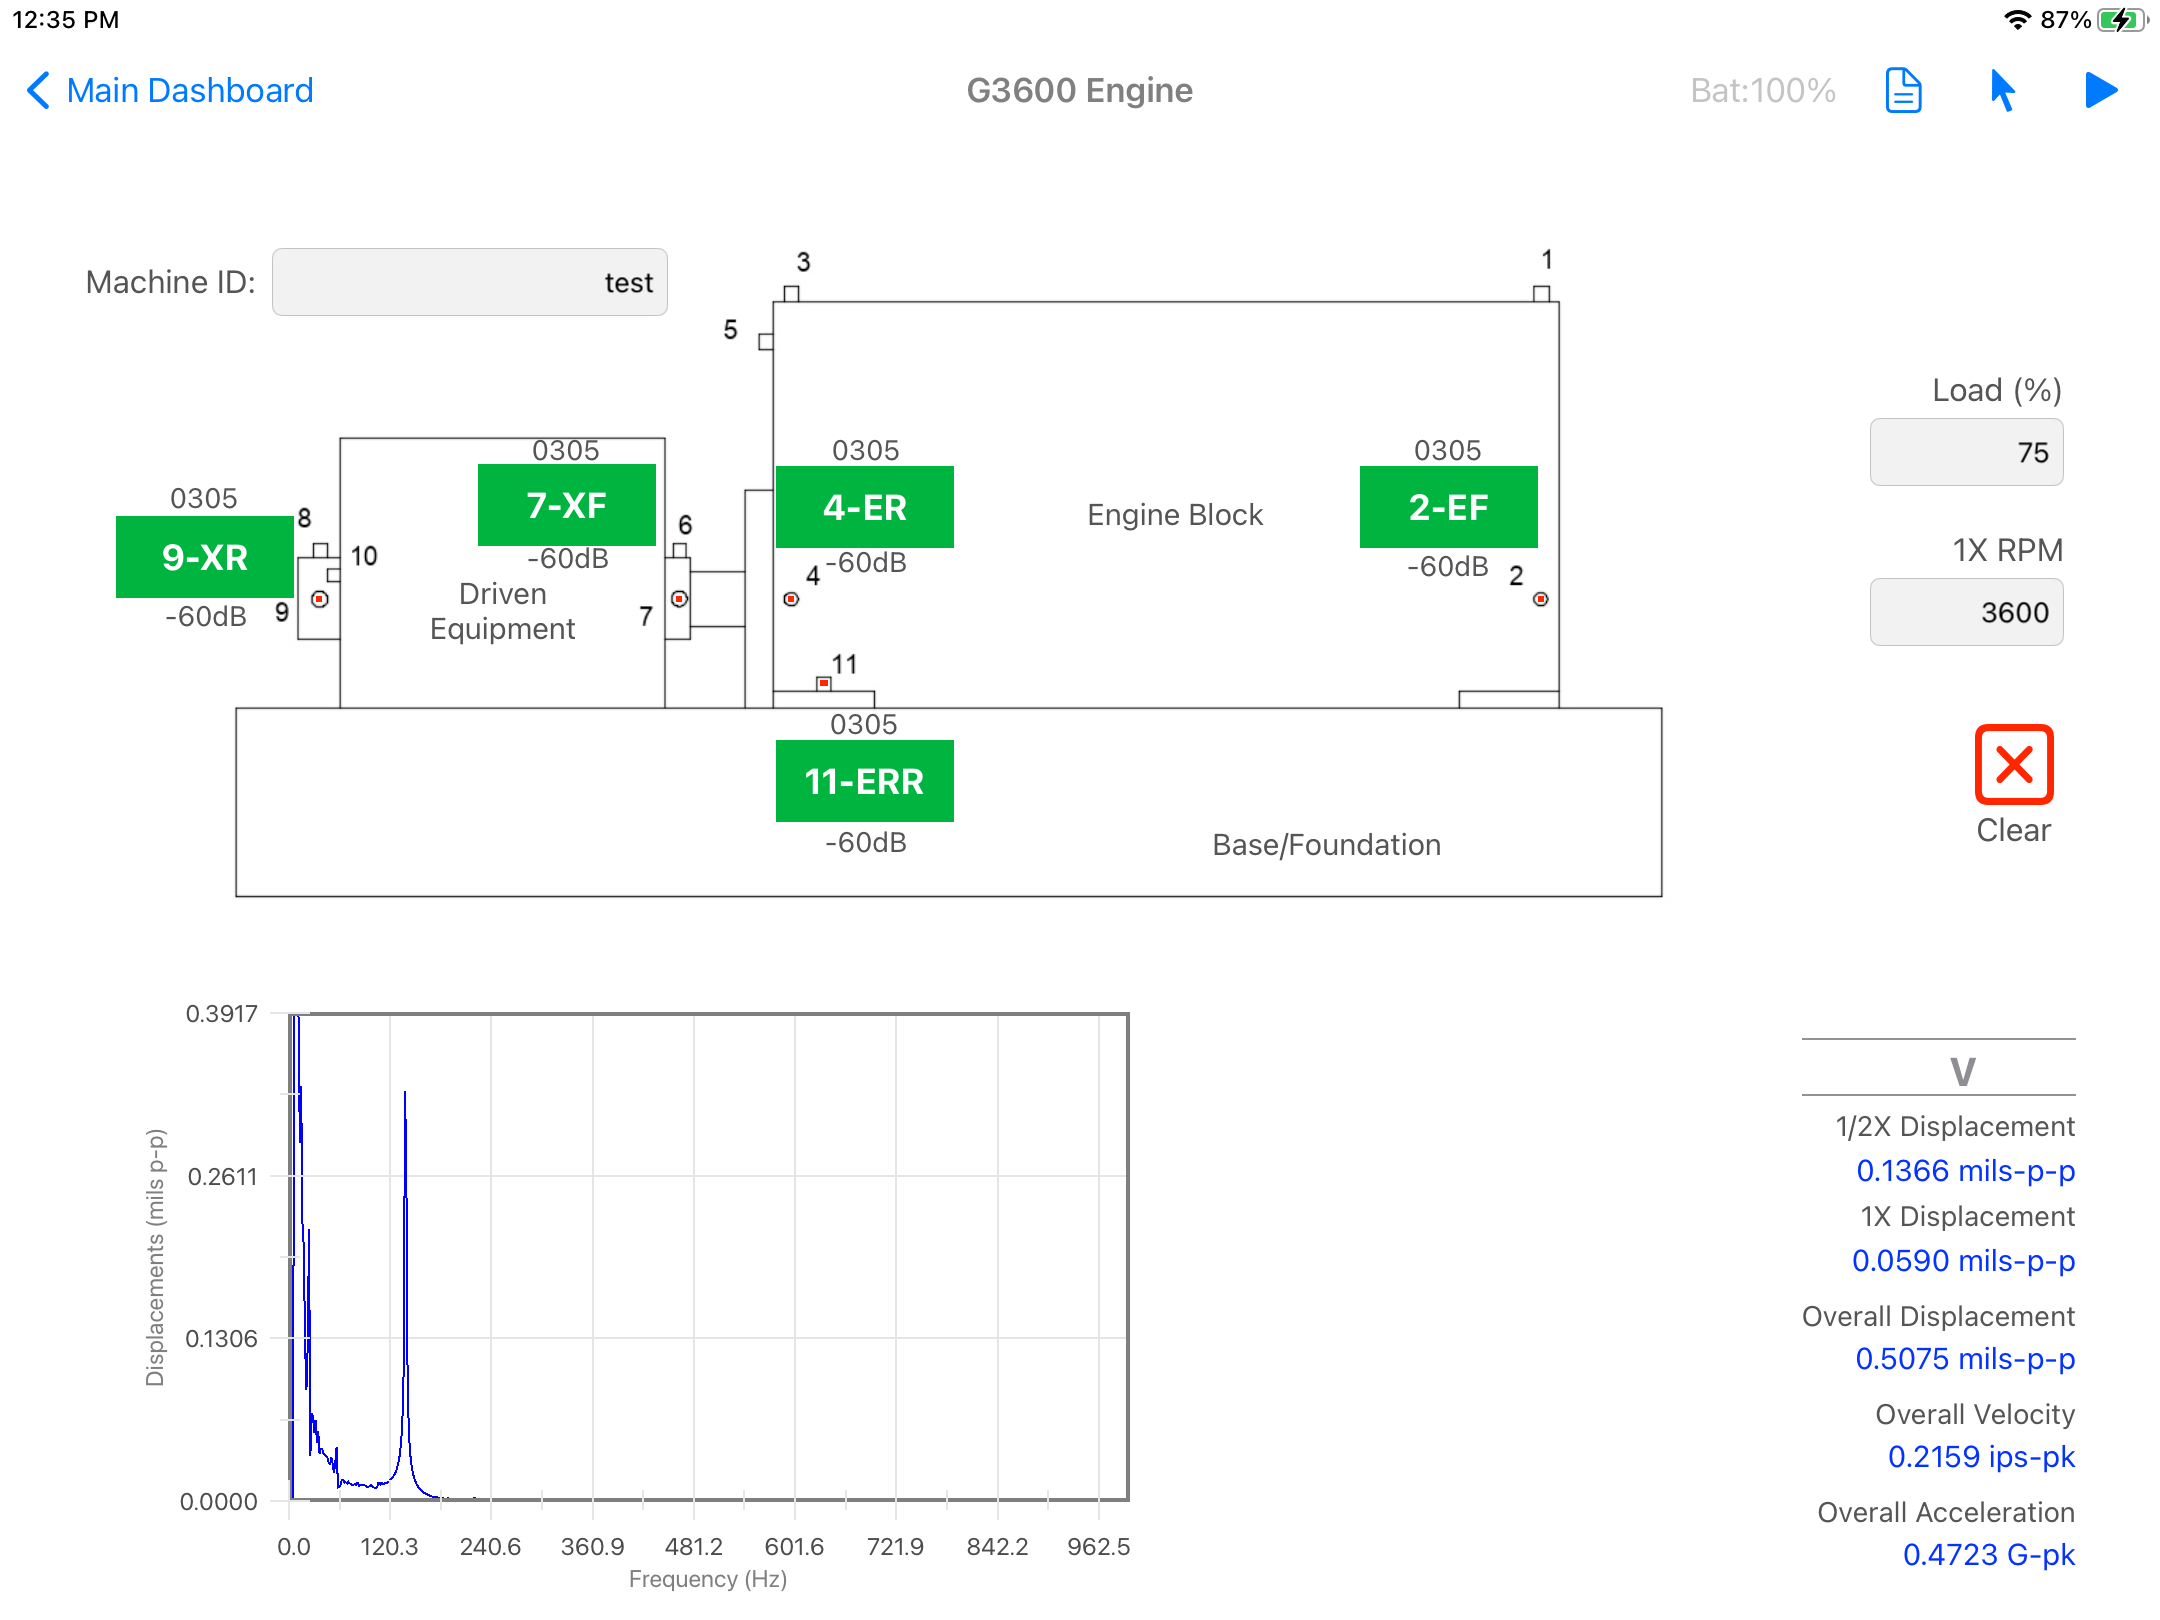
- To assign a sensor to a location, 1: Tap on the sensor on the list and then 2: Tap on the box of the location as shown below (each sensor ID will be displayed on top of each box). Repeat for each sensor and location. Turn the "Config" switch OFF and the app will scan the sensors and activate each location (each connected sensor will show a solid box and RSSI of the signal will be shown in the bottom of each box).
- Enter the machine ID on the top left corner of the screen and enter the machine RPM and load for the test. The "X" clear button will delete all previous recorded data.
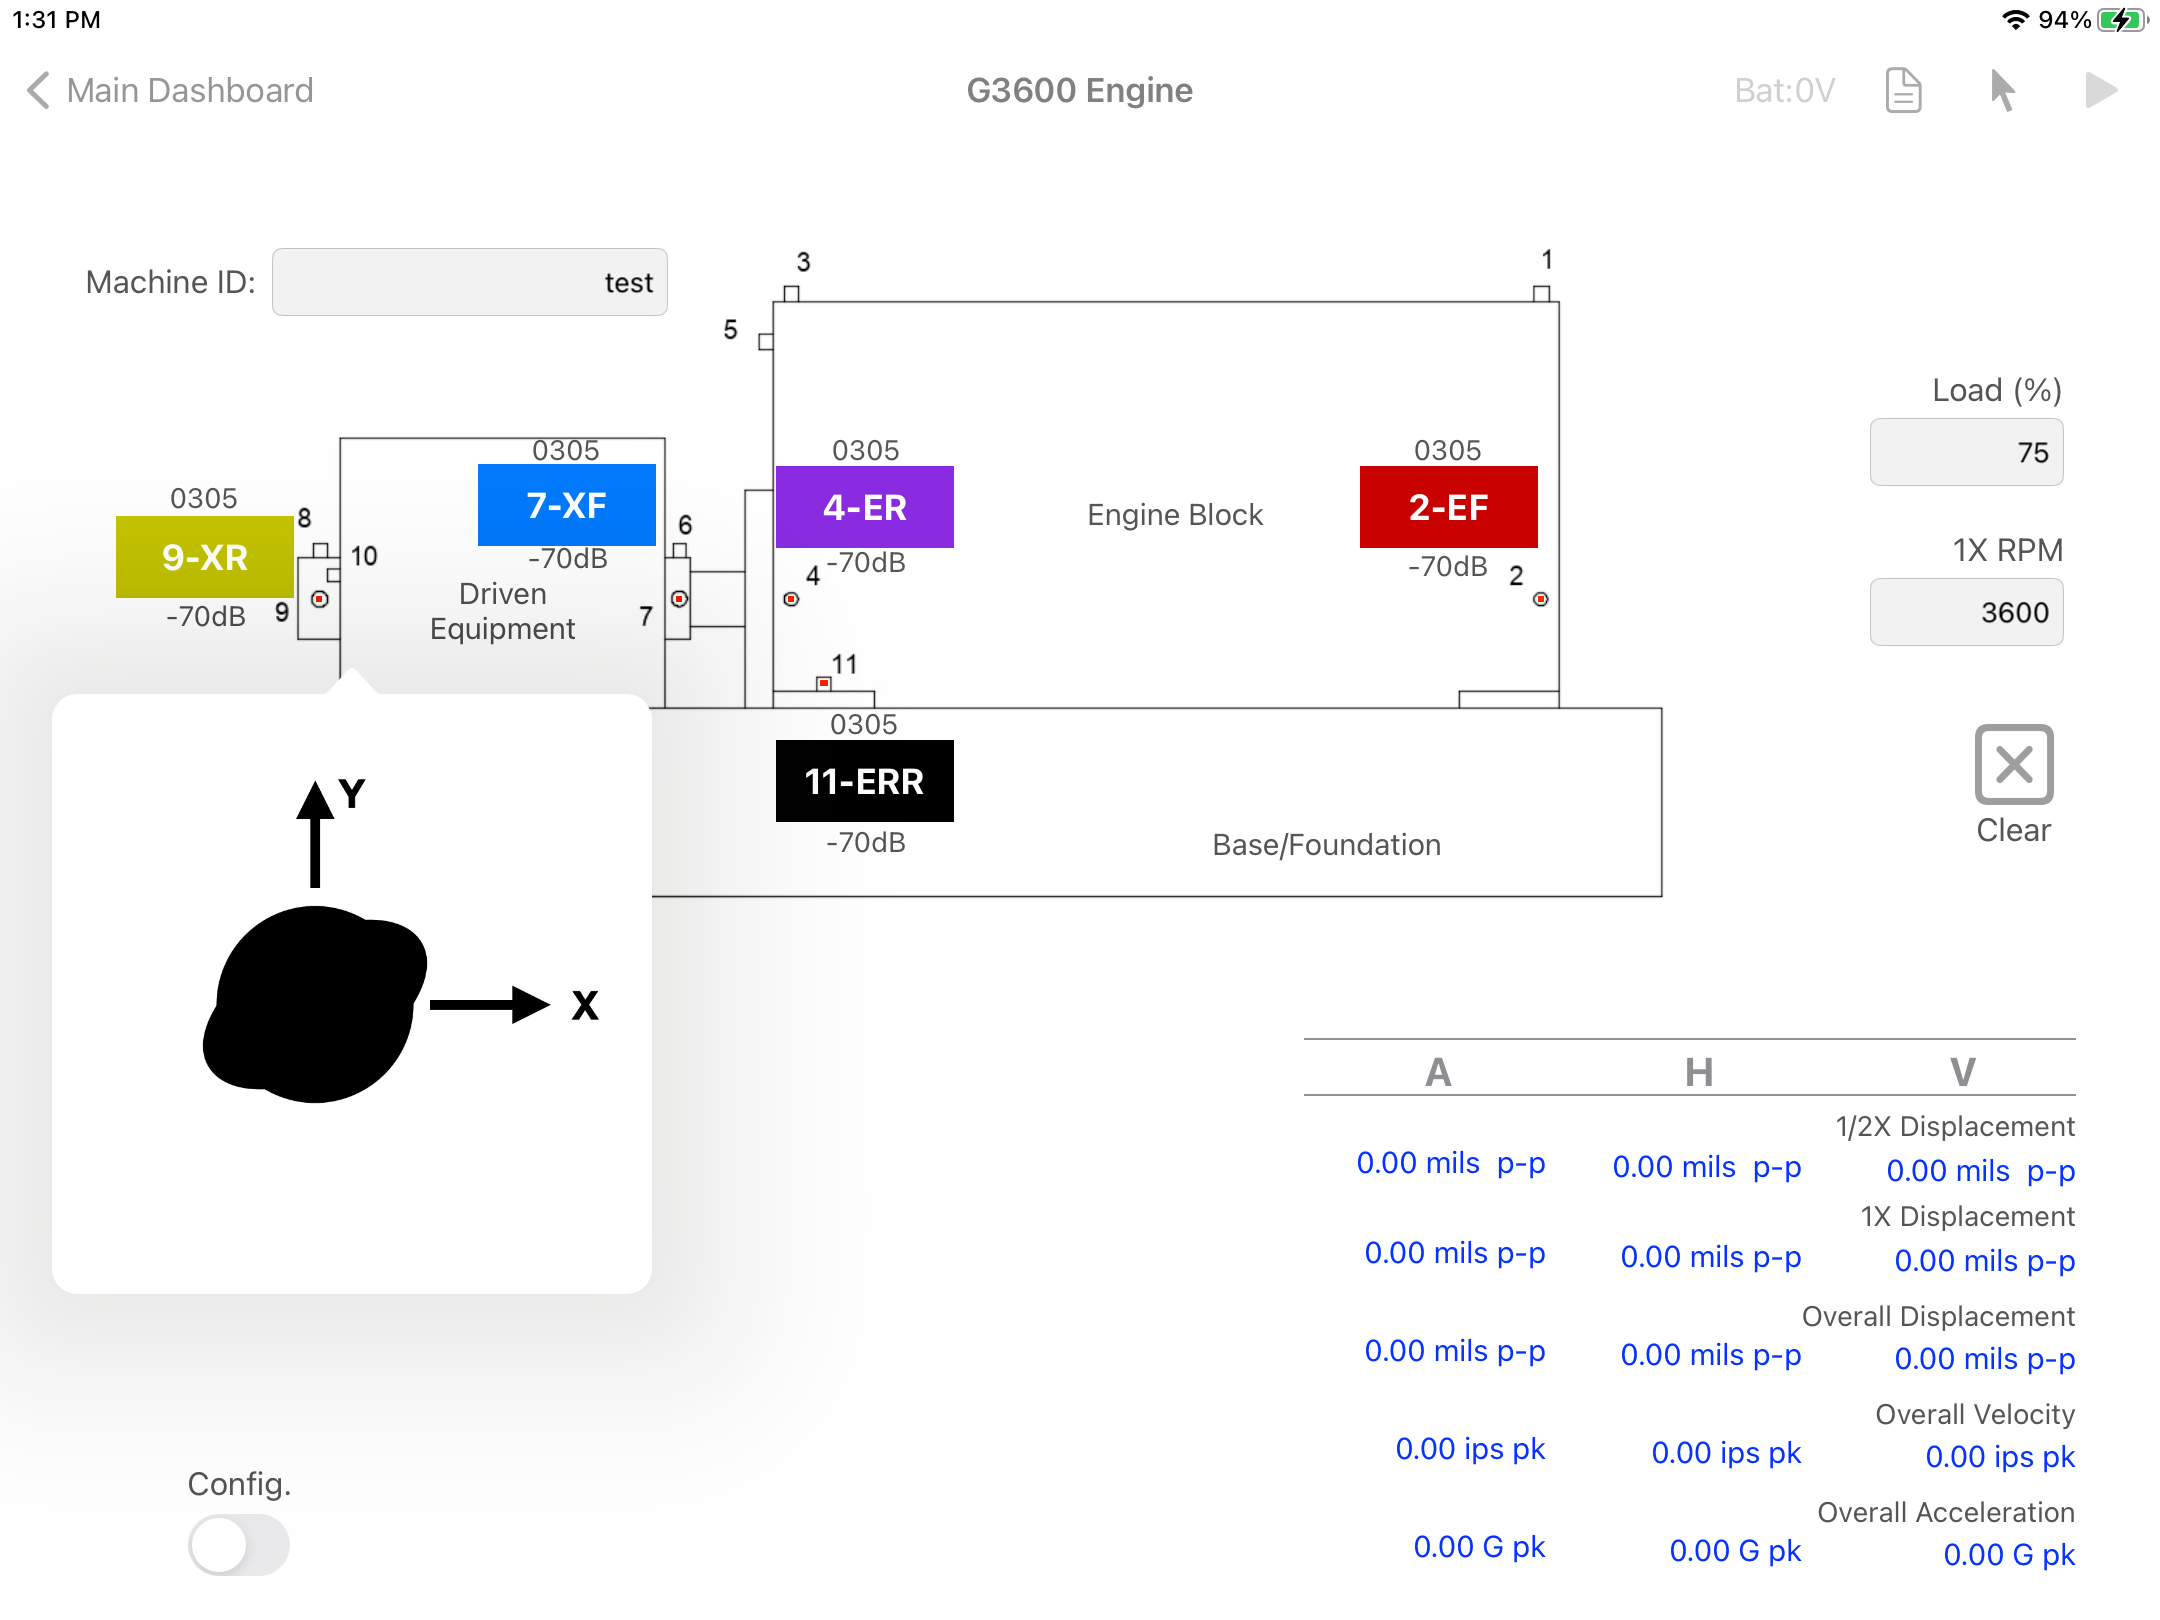
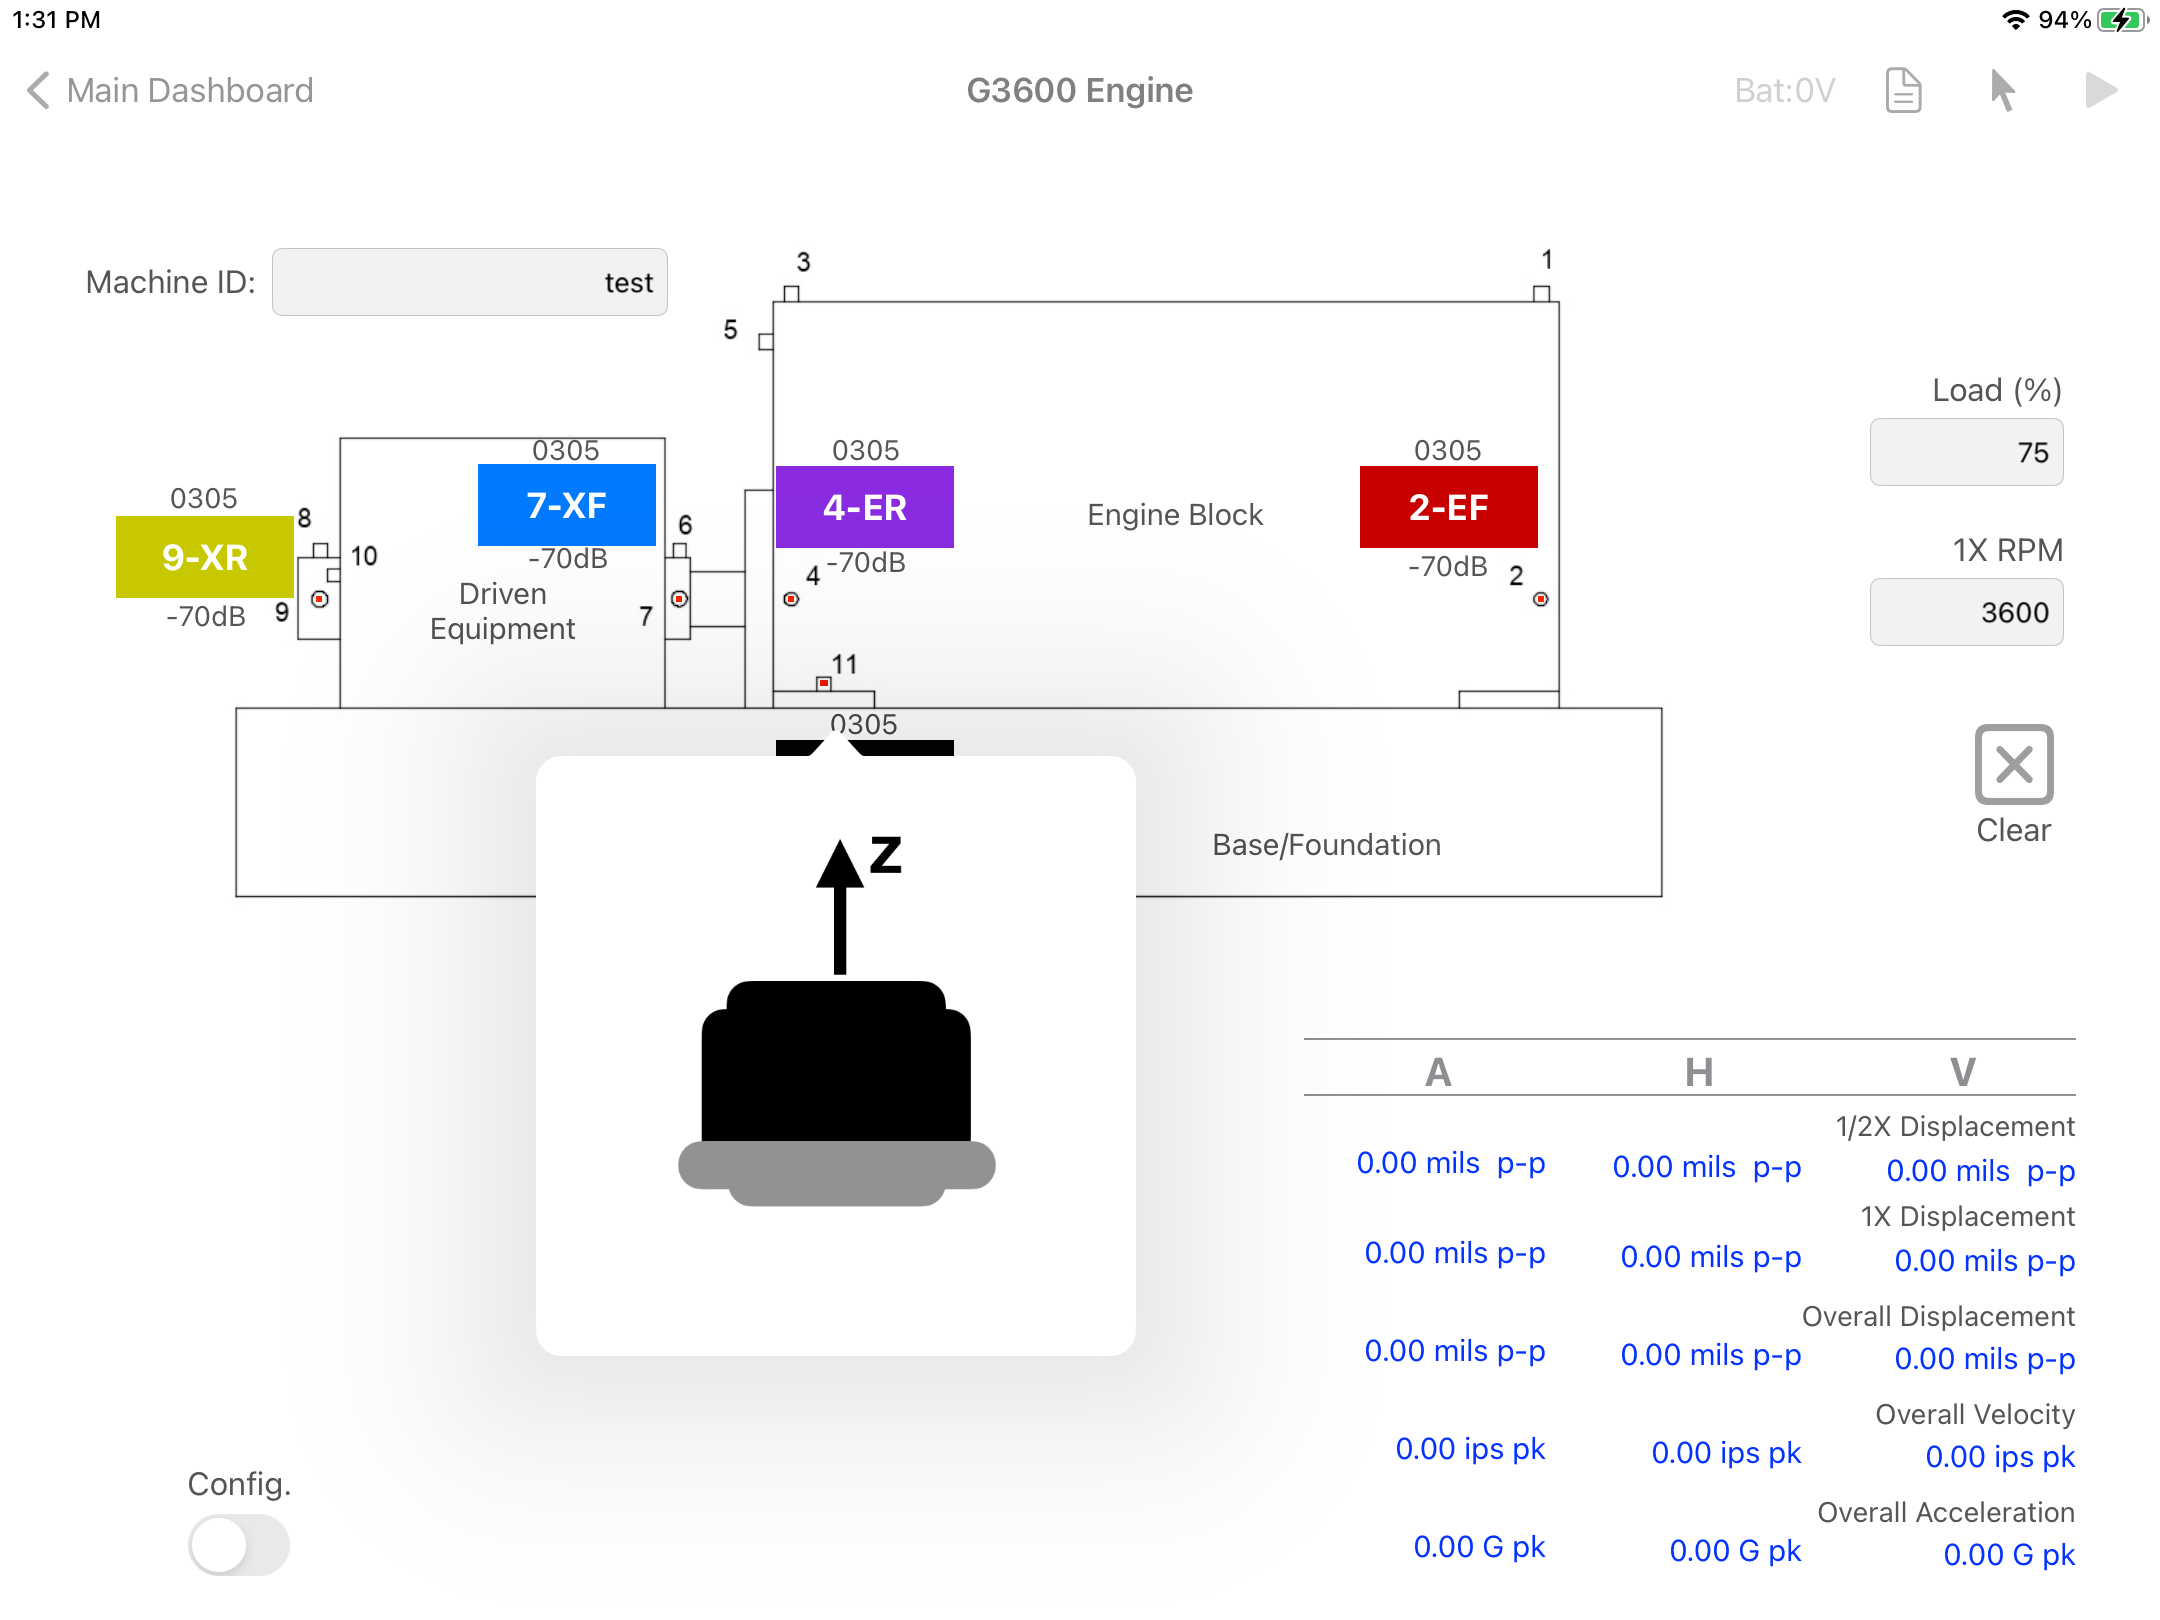
- Mount all the sensor on the their locations on the machine. Each location requires the sensor to be mounted in a specific orientation to collect the neccesary data, some points eill need 1-axis and other points 2 o 3-axis simoultaneous measurement. Click on the red dot for each location to open a dialog box with the sensor orientation.
- Start collecting data by pressing on each box. After data is collected the box will turn green and data will be stored for the report. The sampling setting are automatically selected to comply with the CAT Standard, but the report logo, units and plot line and cursor thickness can be modified in the Configuration screen.
- Repeat the process with all 5 locations until all points are green.
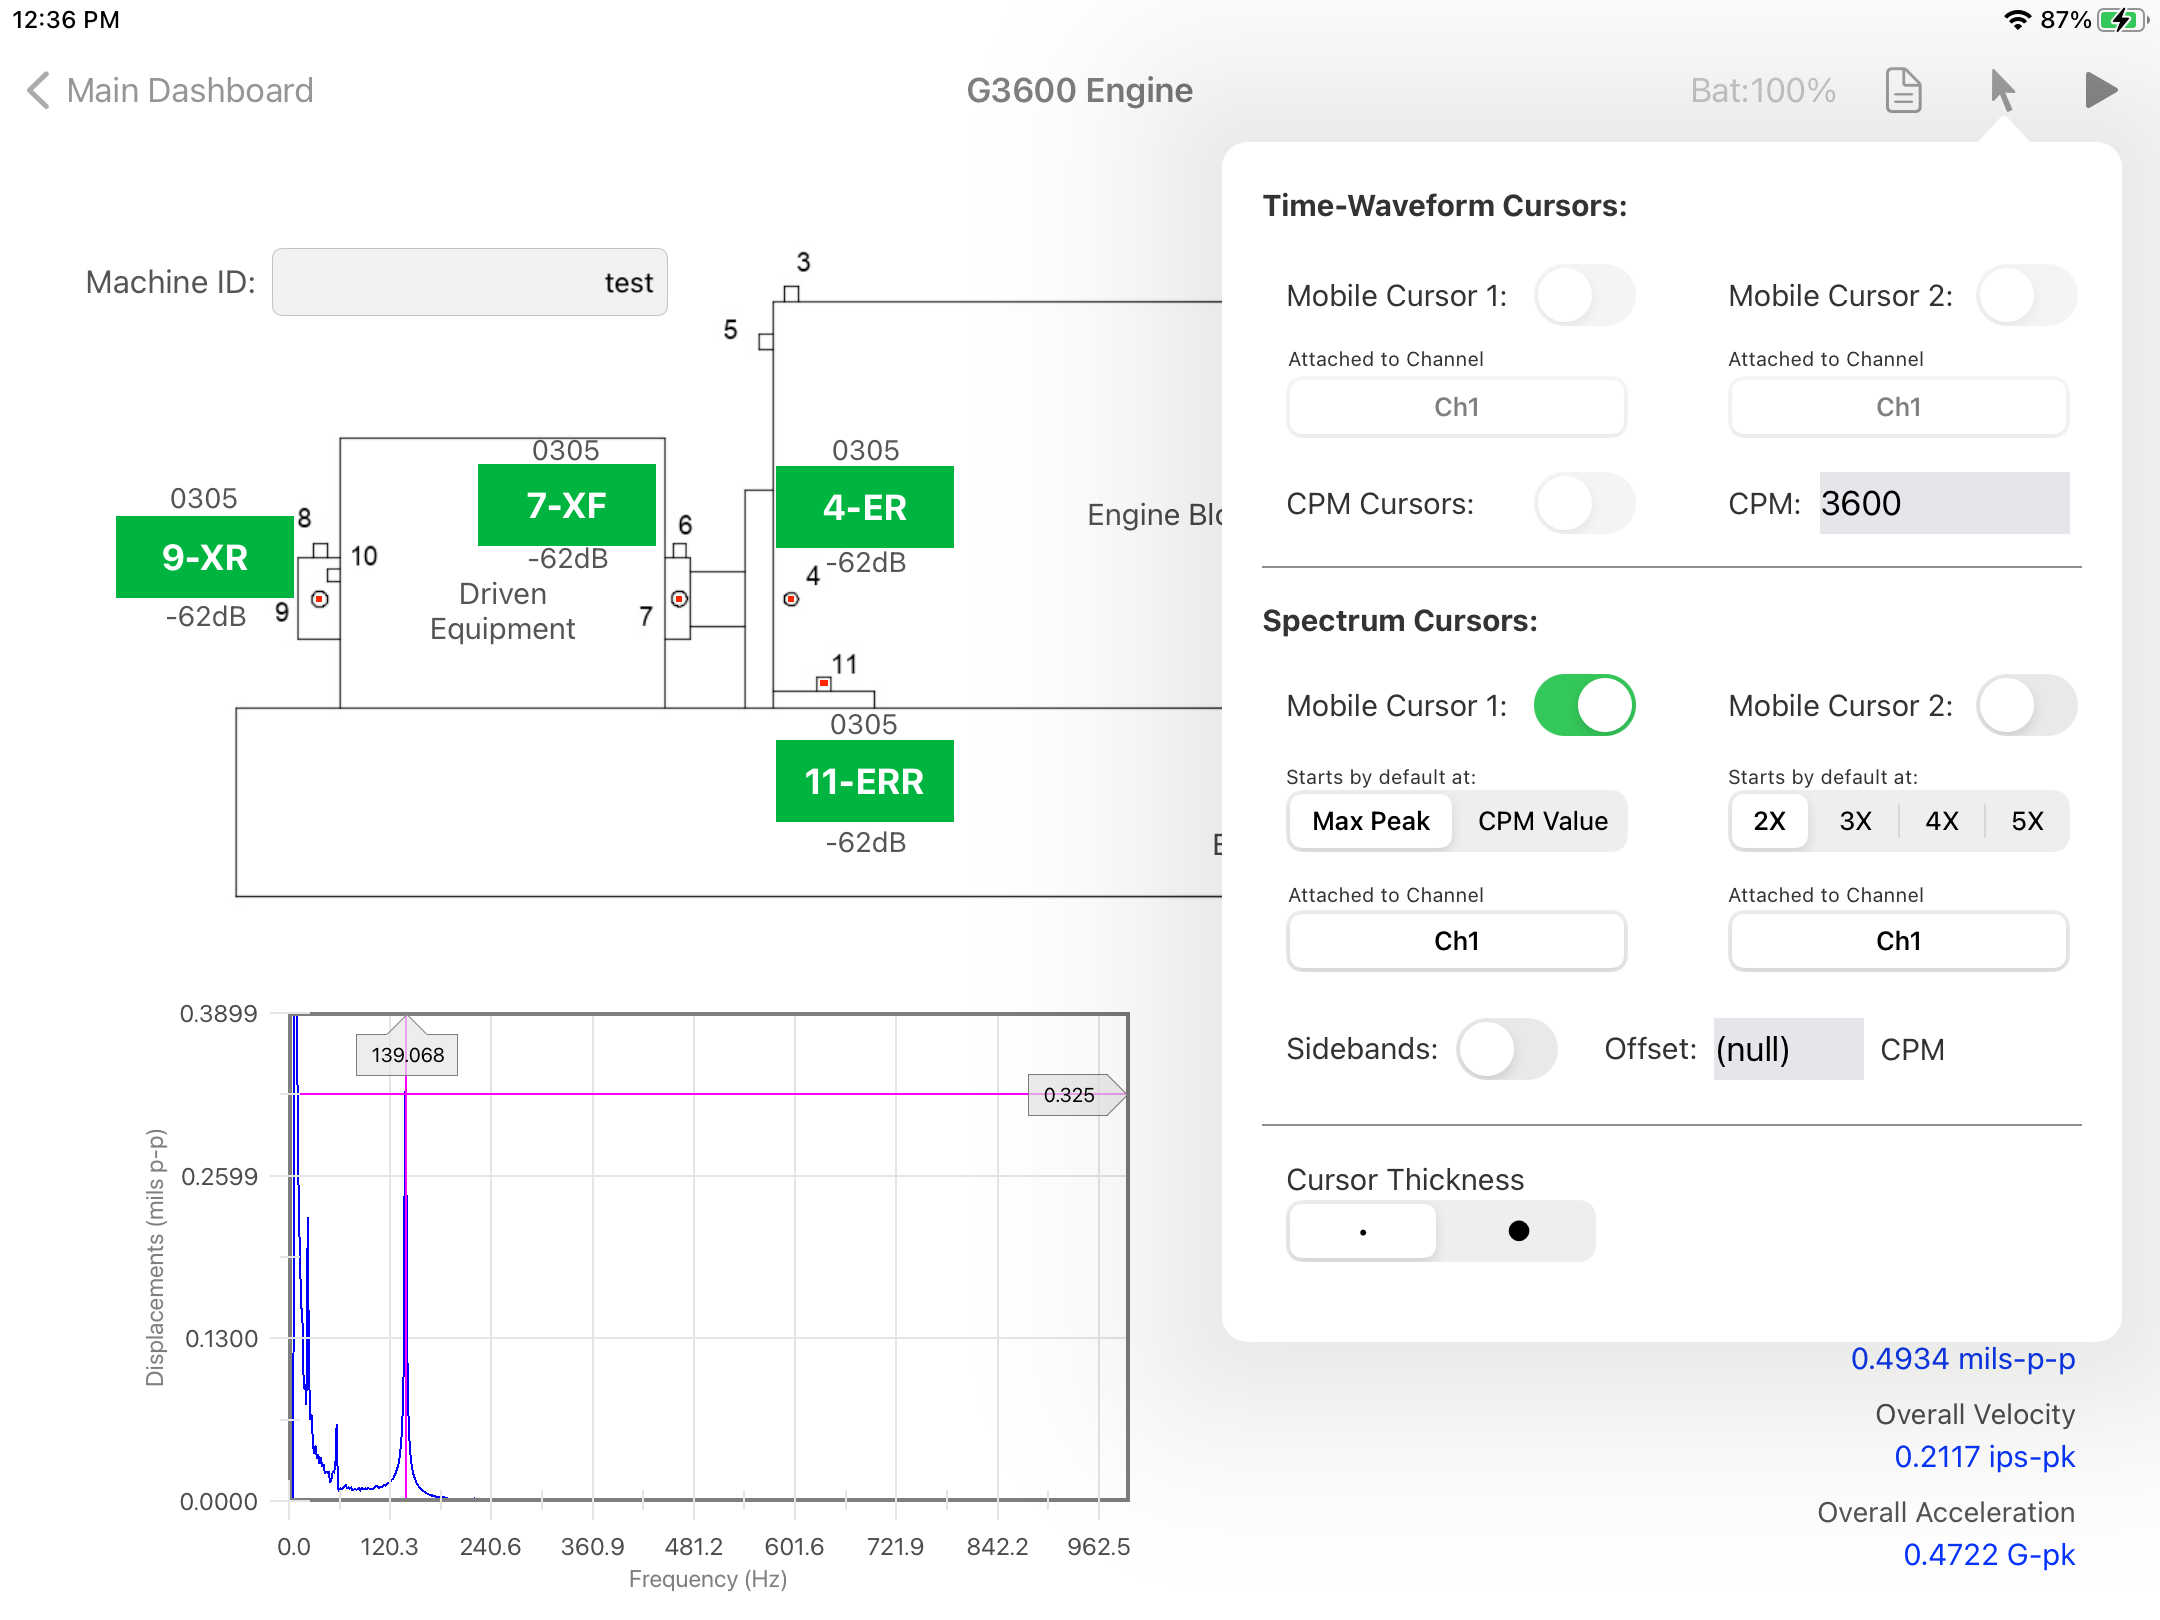
- Click on the cursor button on the top bar menu to add cursors to each spectrum before measuring . An automatic High peak cursor or RPM curosr can be selected and then moved manually to any location on the spectrum. A secondary cursor can be added and used as an harmonic cursor by selecting the multiplier value.
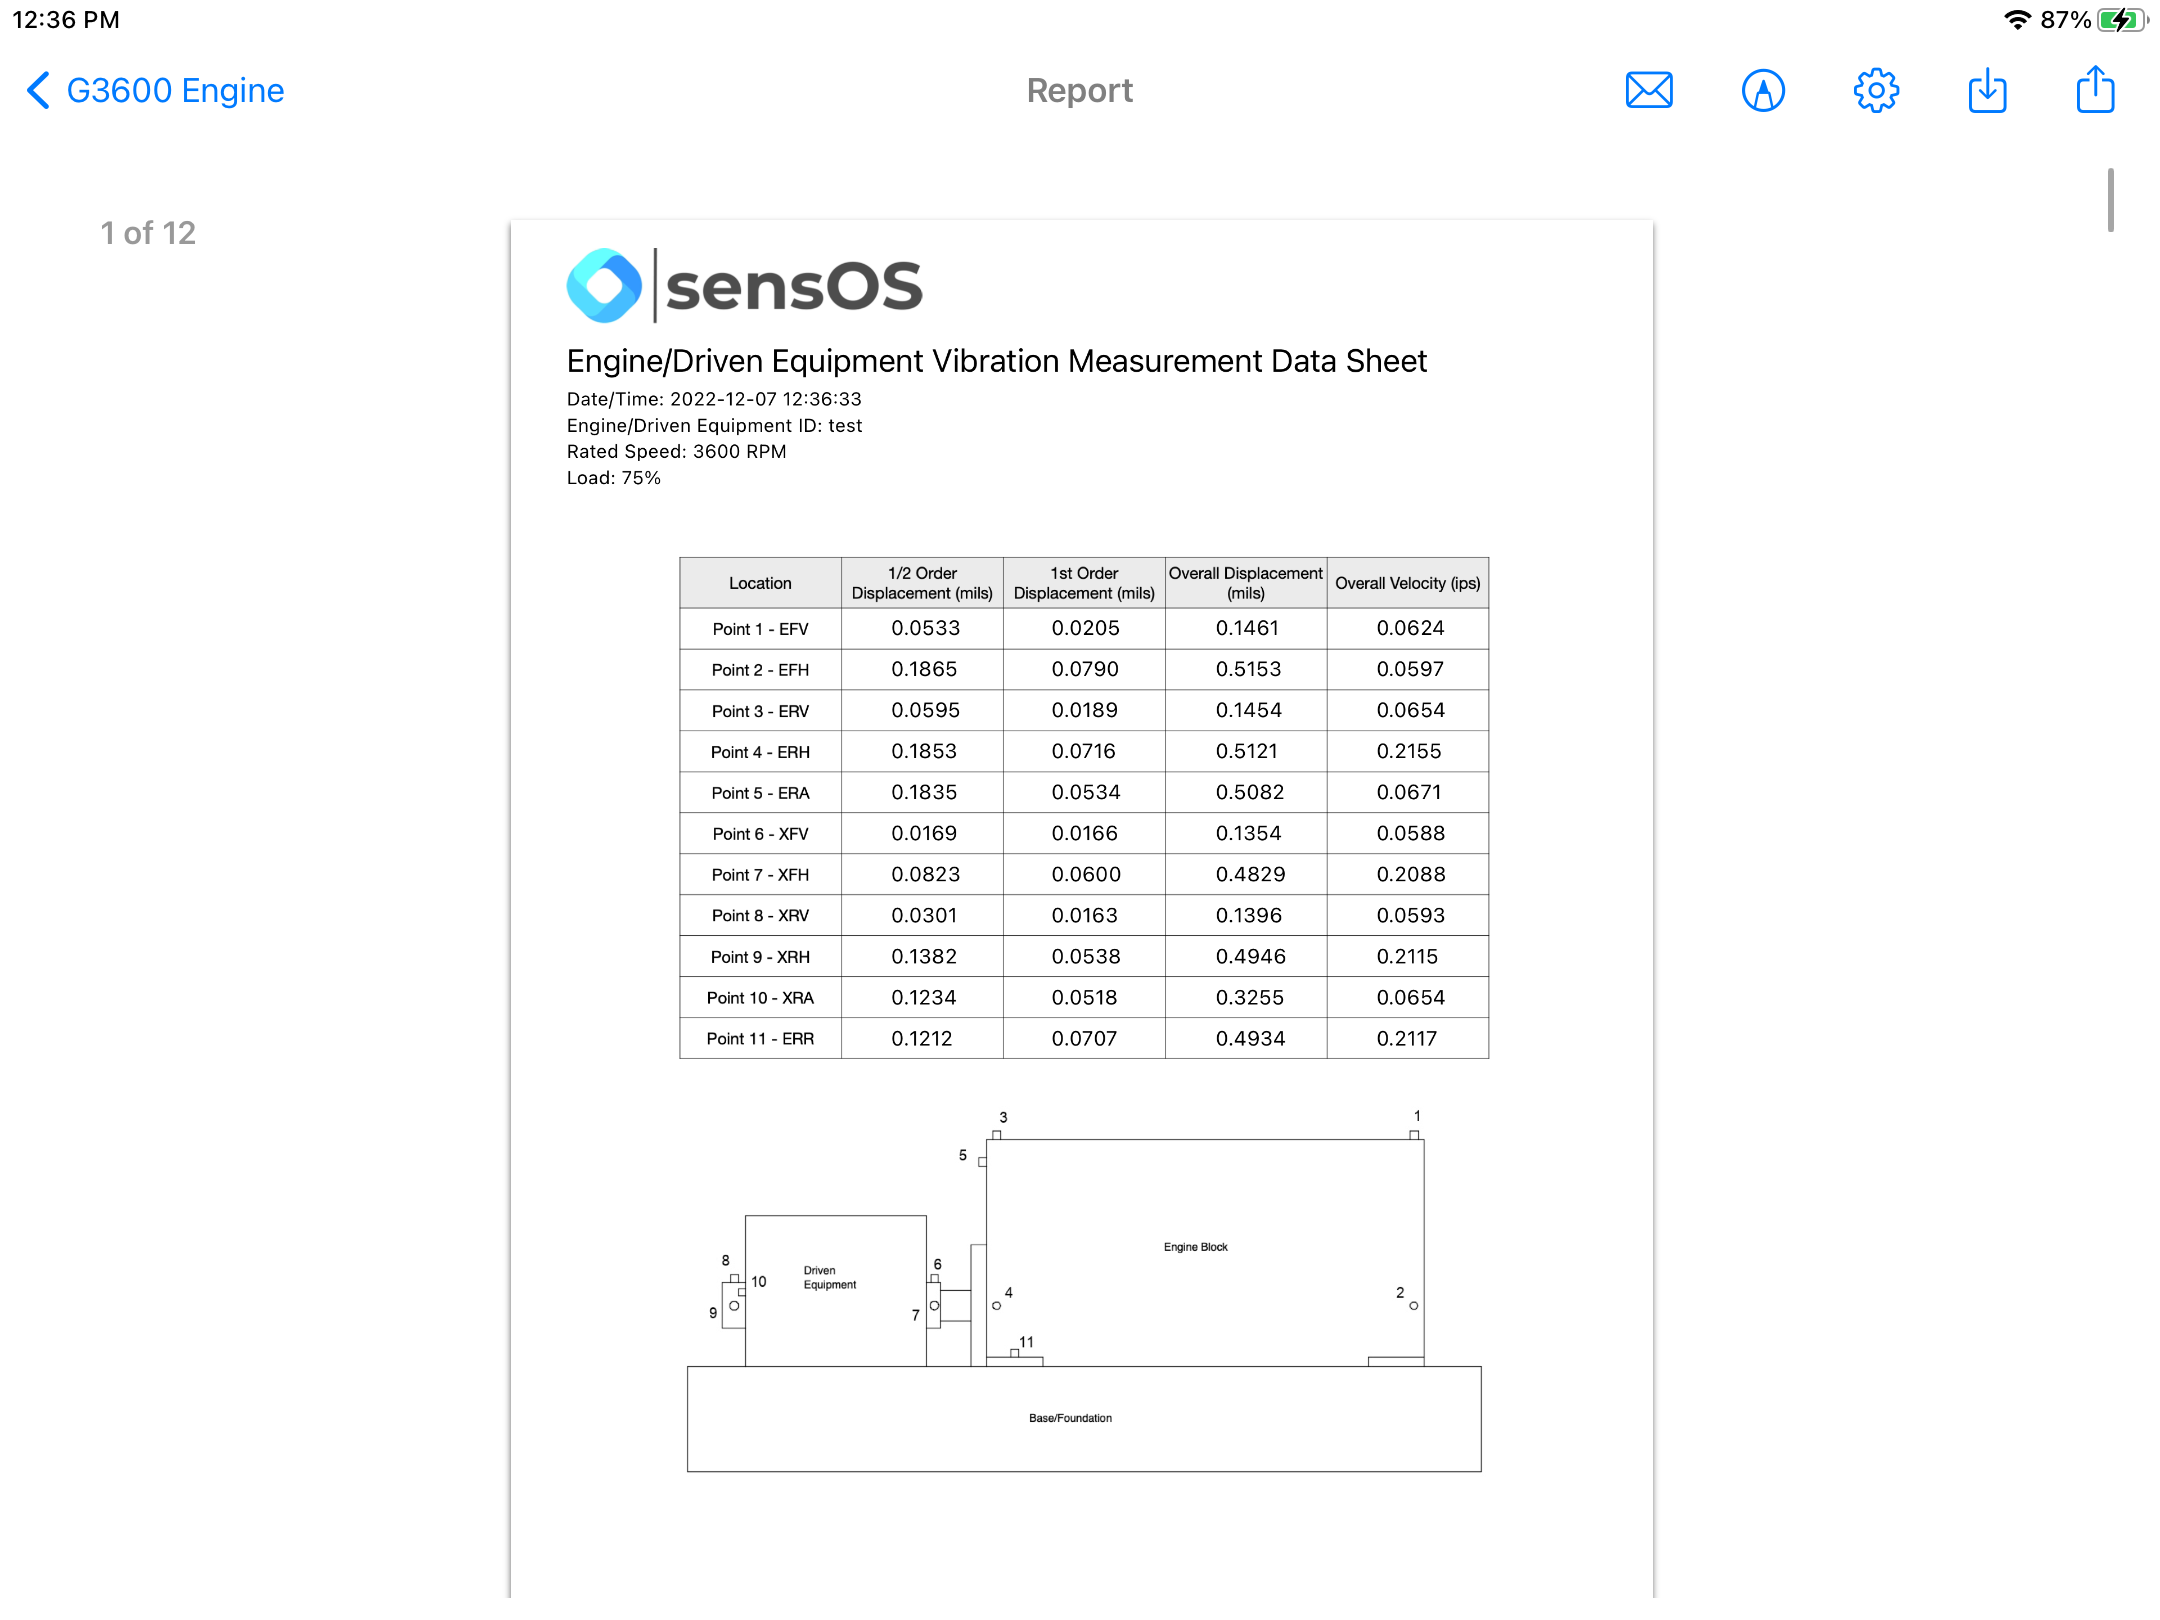
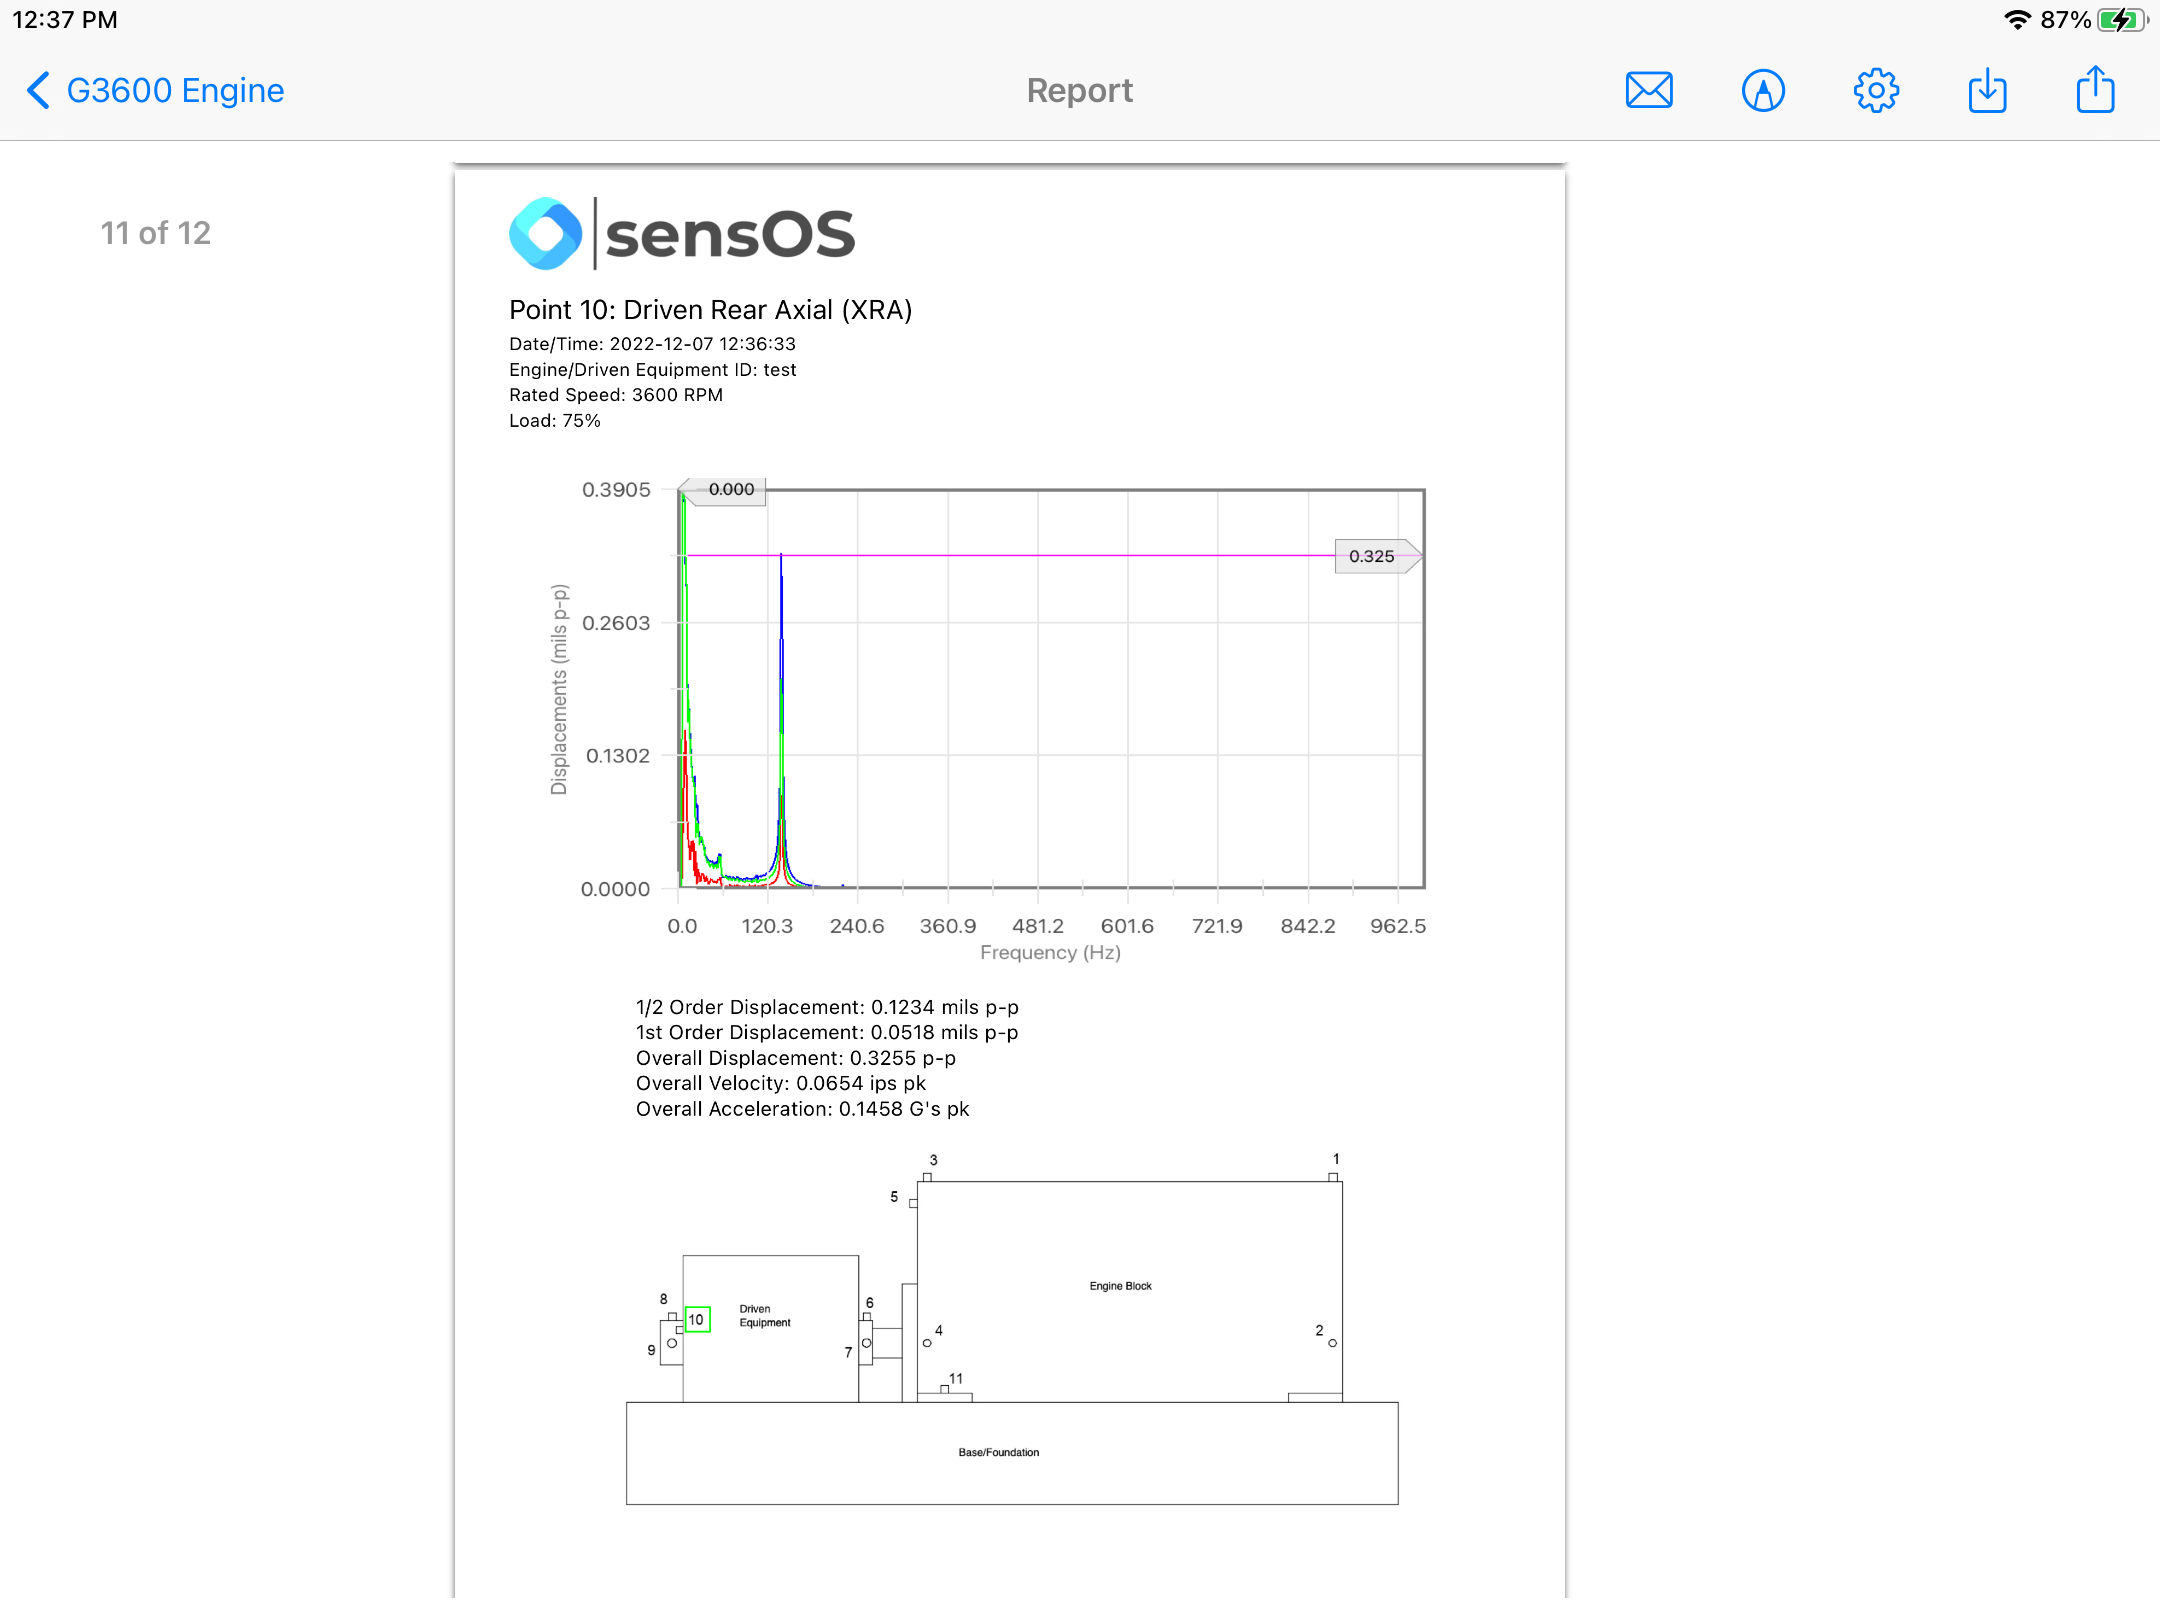
- A full 12 pages report can be generated by pressing the report button on the top bar menu. See Report for more details.
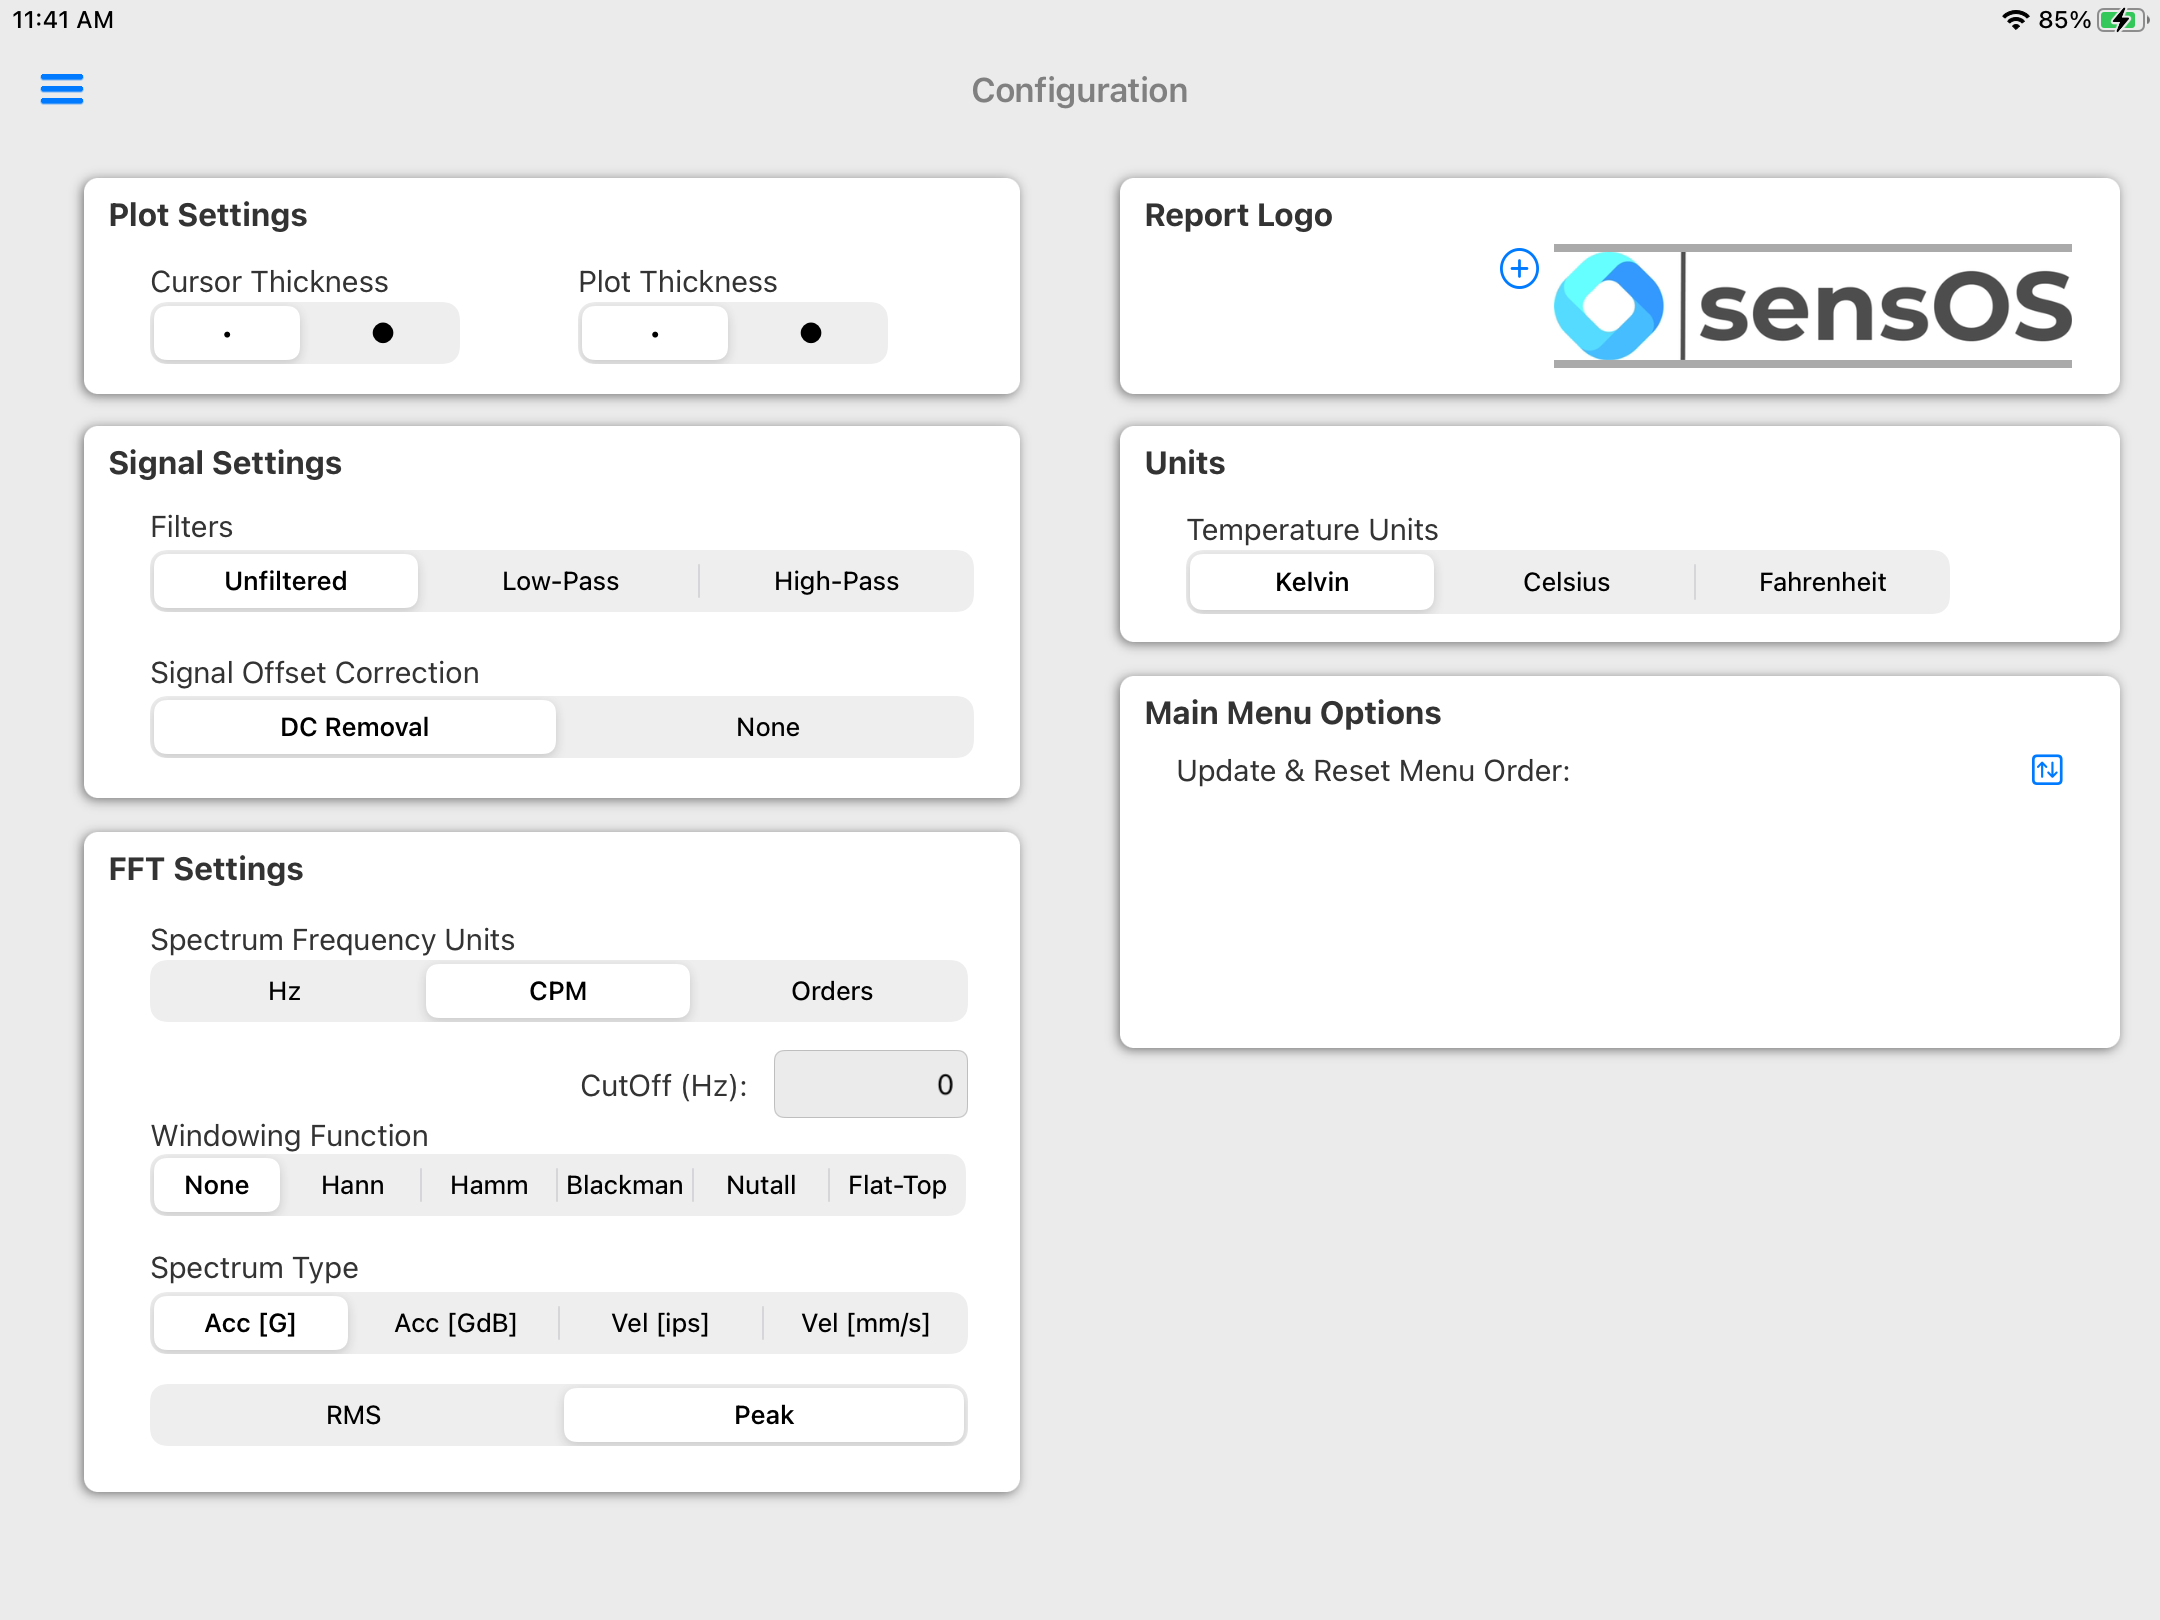
- From the Main menu, click the top left menu button to open the left drawer with more options. Select 'Configuration' from the left menu
- Load the logo to be used in the Report and select other settings to be stored as defaults.
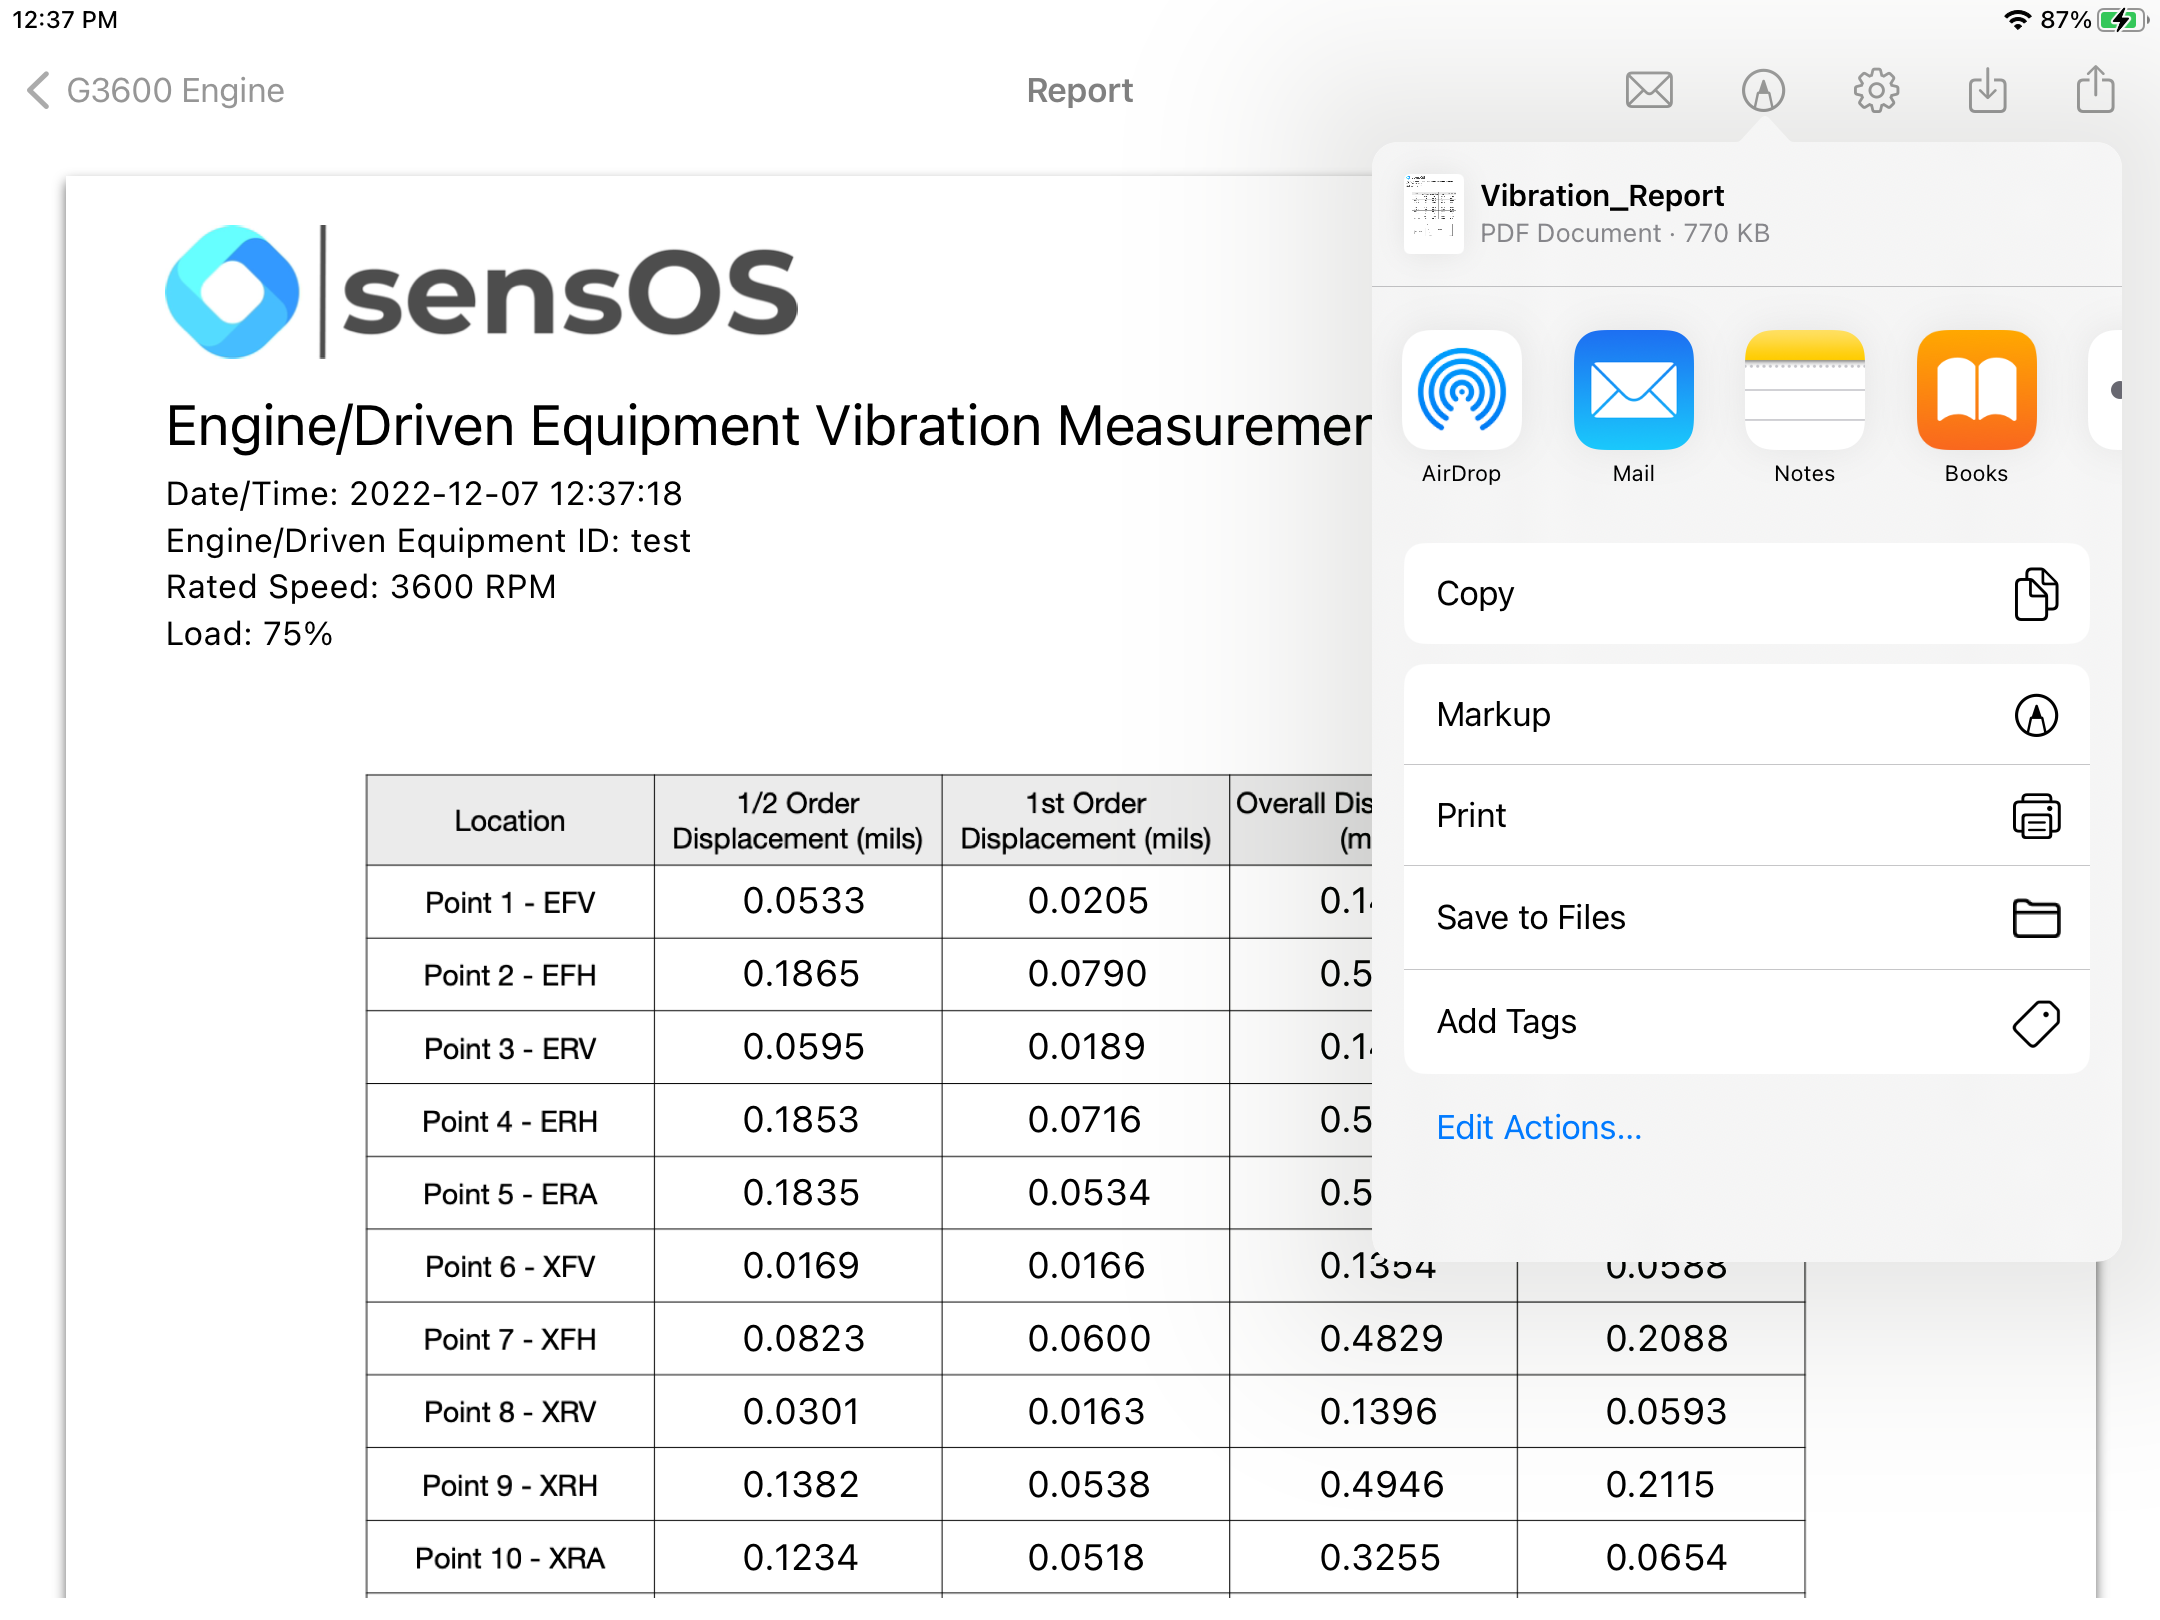
- The report view contains several options in the top bar menu: 1:Send by Email, 2:Markup, 3:Configuration, 4:Save Report locally in the device, and 5:Upload Report to the Cloud bucket
- The markup tool allows the user to copy the report to the clipboard, send it by Airdrop or any other messaging app, email it, print it or saved it to Files. The markup tool will open the standard tool to paint on the pdf report.
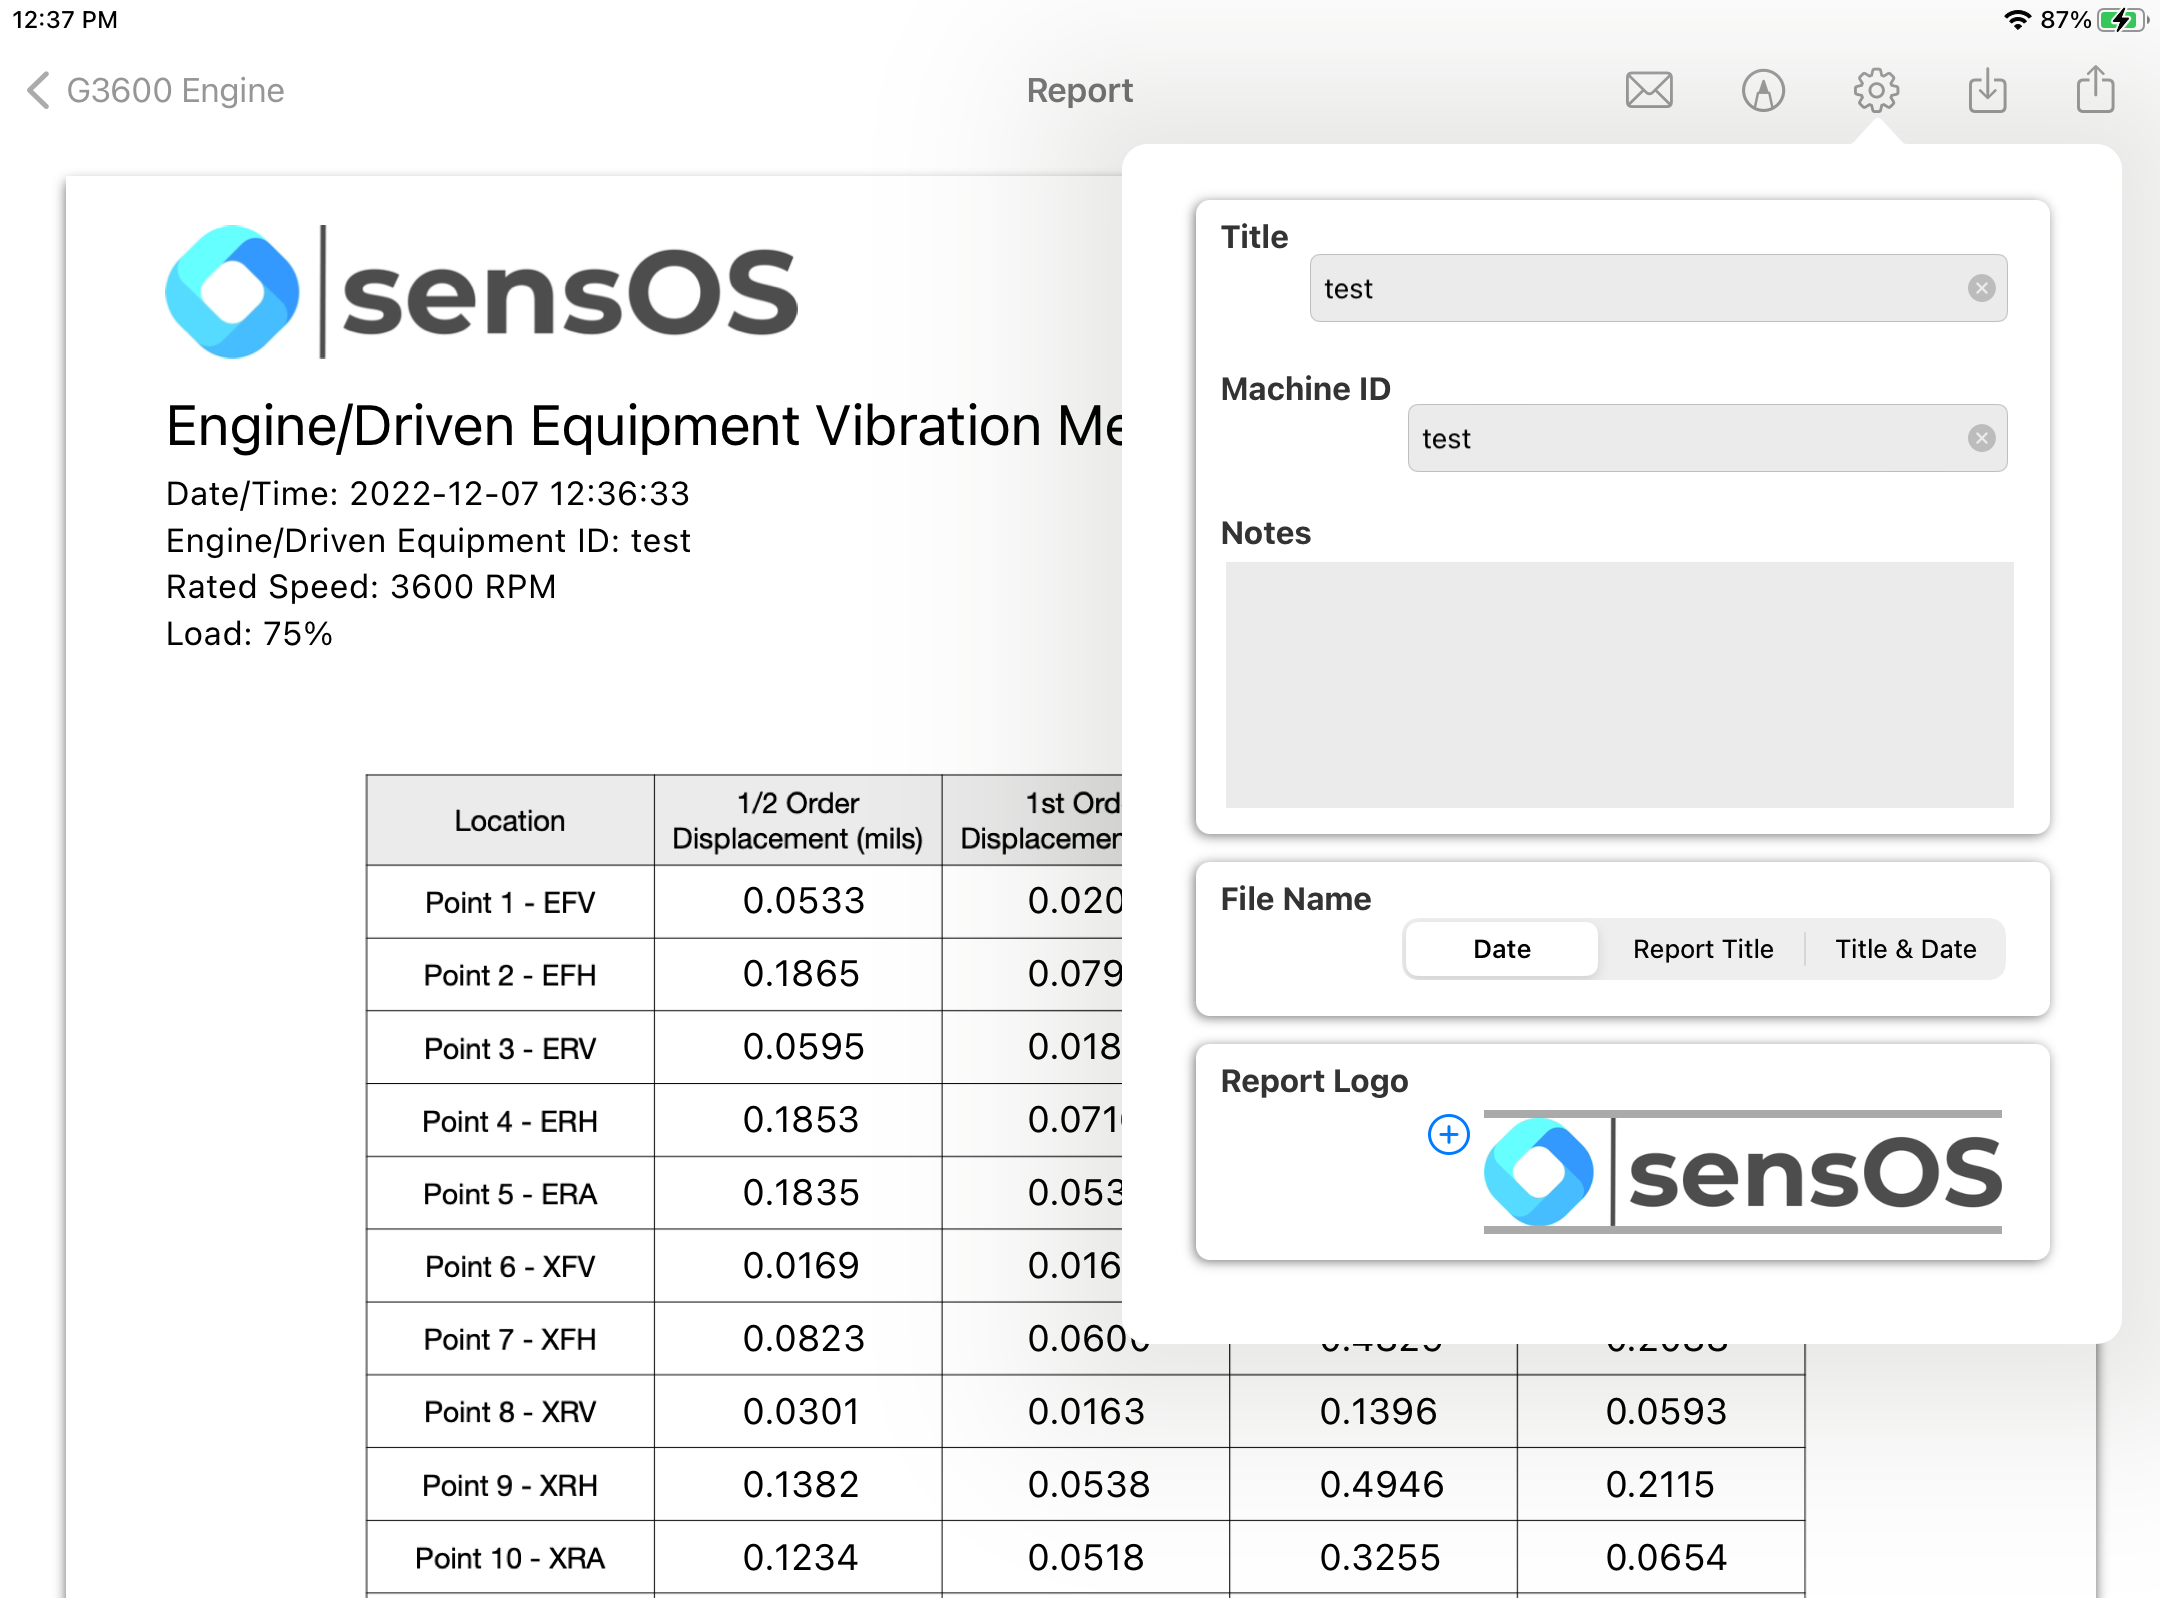
- The Report Configuration pop-up allows the user to enter the Report Title, Machine ID and Notes to be added to the report. Here the user can also select a logo for the report. The report file name be default is the actual dat and time, but the user can change it to the title name of the report or to both, the title name and date.
- Optimized Optimized for iPadOS®16


Configuration
Report
Changelog
See what's new added, changed, fixed, improved or updated in the latest versions.
Version 1.15 b.29 (22 Nov, 2022)
Version 1.05 b.15 (03 Jun, 2022)
Initial Release